Figure 15.

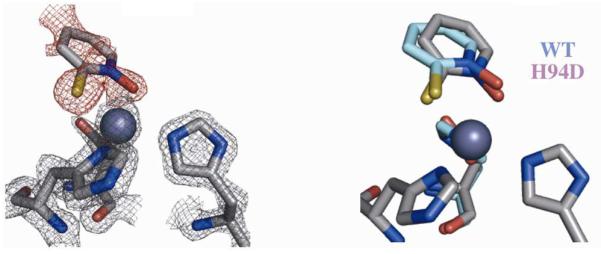
Crystal structure of 2e bound to hCAII H94D (left). The Fobs map (2σ) for the protein is shown in gray while the Fo-Fc omit map (2σ) for 2e is shown in red. An overlay with the WT structure shows little change in binding geometry (right).

Crystal structure of 2e bound to hCAII H94D (left). The Fobs map (2σ) for the protein is shown in gray while the Fo-Fc omit map (2σ) for 2e is shown in red. An overlay with the WT structure shows little change in binding geometry (right).