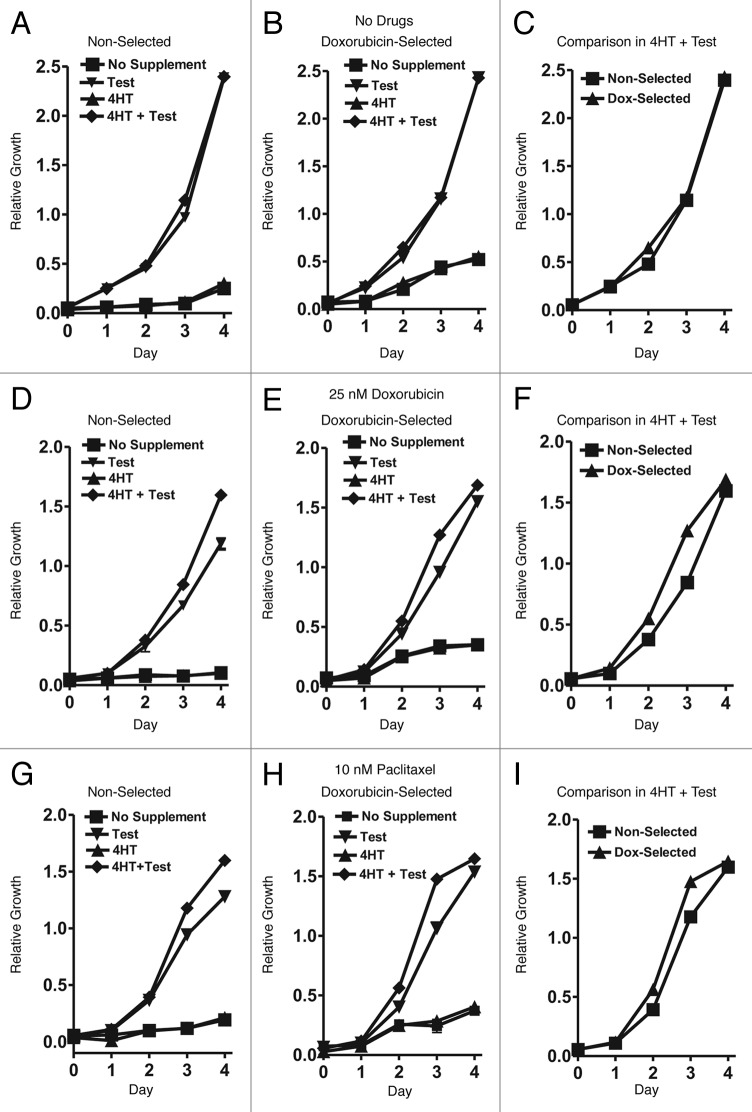
Figure 4. Dominance of Raf-1 in promoting proliferation and drug resistance. Growth was measured over a period of 4 d in the presence of no drugs (A–C), 25 nM doxorubicin (D–F) or 10 nM paclitaxel (G–I). Symbols: solid squares (■) = no supplement, solid downward triangles (▼) = 100 nM Test, solid upward triangles (▲) = 500 nM 4HT, solid diamonds (◆) = 500 nM 4HT + 100 nM Test. Each data point is the average of 8 replicates.

An official website of the United States government
Here's how you know
Official websites use .gov
A
.gov website belongs to an official
government organization in the United States.
Secure .gov websites use HTTPS
A lock (
) or https:// means you've safely
connected to the .gov website. Share sensitive
information only on official, secure websites.
