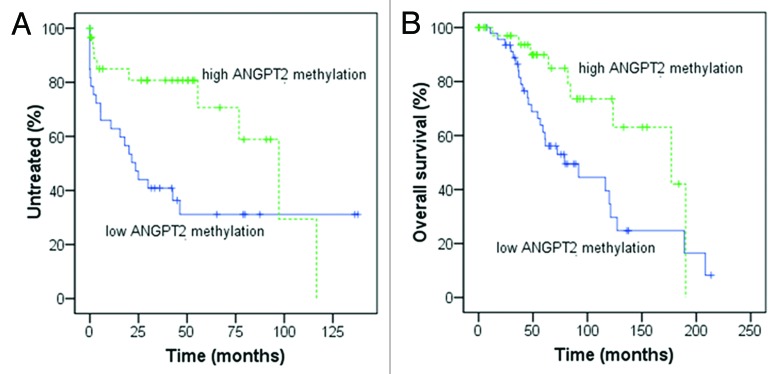
Figure 4. Kaplan-Meier curves for time to first treatment (TTFT) and overall survival (OS) in relation to ANGPT2 CpG methylation. In (A and B), 88 CLL patients were divided according to high and low ANGPT2 methylation using the cut-off value 73% (methylation percentage, average of all 6 CpG sites). Low ANGPT2 methylation cases had significantly shorter TTFT [(A) median 23 vs. 97 mo, p = 0.022; log-rank test] and OS [(B) median 79 vs. 177 mo, p = 0.018; log-rank test] compared with cases with high ANGPT2 methylation.
