Fig. 2.

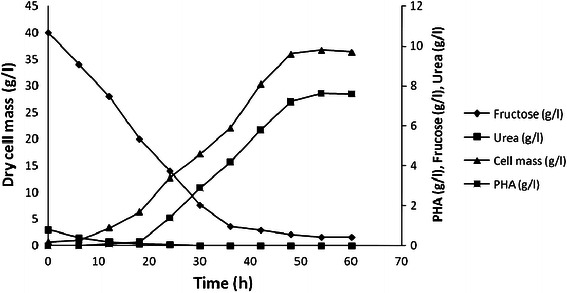
Time profile of PHA and cell mass production, fructose and urea utilization in 7.5 l New Brunswick Bioflo Fermentor (working volume 3.0 l)

Time profile of PHA and cell mass production, fructose and urea utilization in 7.5 l New Brunswick Bioflo Fermentor (working volume 3.0 l)