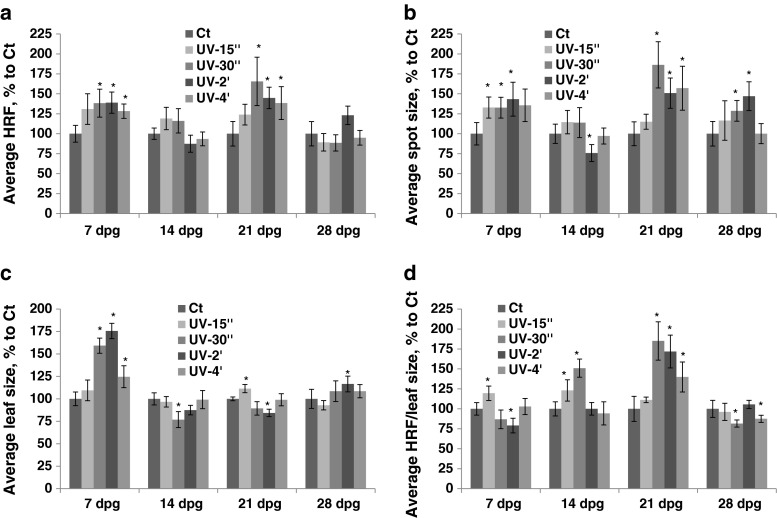
Fig. 5.
The analysis of HRF, the size of recombination events, leaf size and HRF per leaf size in the progeny of plants exposed to UV-C. The parental generation received different doses of UV-C at 7, 14, 21 and 28 dpg. All measurements in the progeny were done in somatic tissues at 20 dpg. The data are shown as a percentage relative to the control taken as 100 %. The error bars indicate a standard error calculated from 8 repeats (2 biological repeats, each with 4 technical repeats). The asterisks show a significant difference compared to the control (p < 0.05). a. Average HRF. b. Average spot size. c. Average leaf size. d. Average HRF related to leaf size

