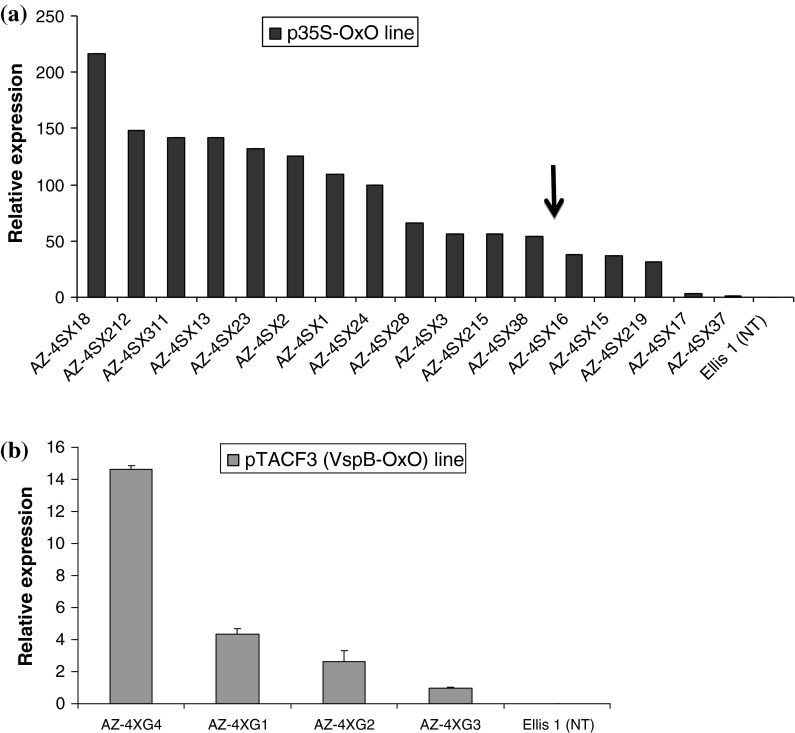
Fig. 1.
Relative expression levels of the oxo gene in tissue culture shoots using RT-qPCR. Non-transgenic (NT) American chestnut controls were the clonal line, Ellis 1, in both graphs. a Seventeen transgenic events made with the vector p35S-OxO (containing a constitutive promoter); b four transgenic events made with the vector pTACF3 (containing a vascular promoter). GAPDH was used as the reference gene. Data represent the mean of three technical replicates. Bars indicate standard error of the mean [note in (a) they are present but too small to see]. Arrow indicates threshold OxO expression level linked to significant reduction in necrosis (Fig. 3)

