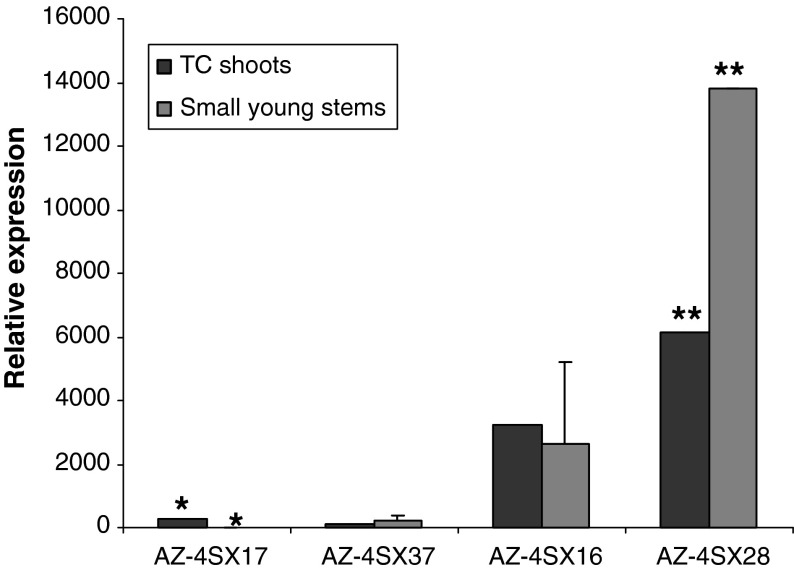
Fig. 2.
A comparison of OxO expression level in tissue culture shoots (TC shoots, black column) and stems (gray column) of young potted plants in the greenhouse of the transgenic line p35S-OxO (events AZ-4SX16, 17, 28, and 37). RT-qPCR with GAPDH as the reference gene was used to determine the expression of OxO. Error bars indicate standard error of the mean. Asterisks indicate significant differences within an event (Single asterisk (*) for event AZ-4SX17; two asterisks for, event AZ-4SX28; P < 0.001) based on t tests. No asterisks means no significant difference within an event (events AZ-4SX37 and AZ-4SX16)

