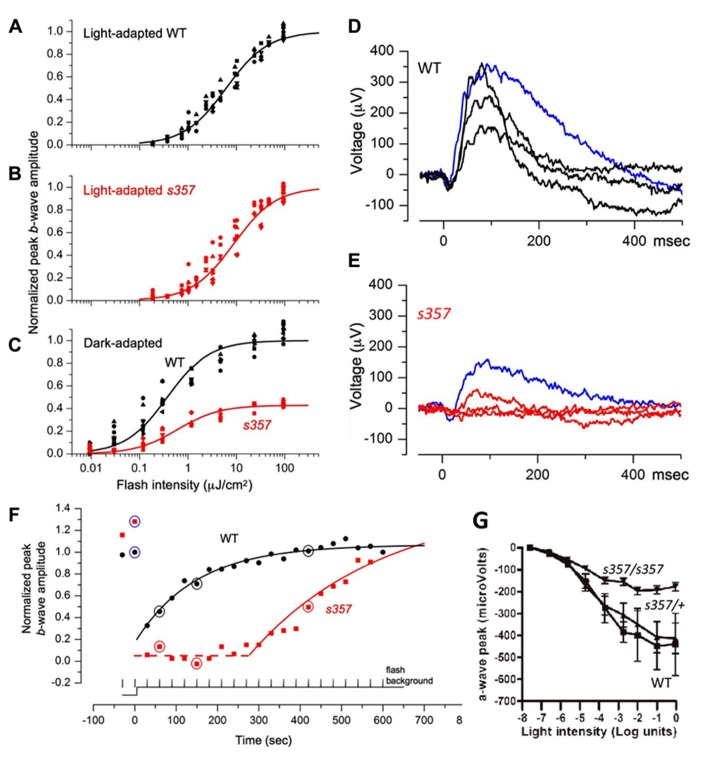
FIGURE 2.
Electrophysiological evidence for visual defects in grs357 mutants. (A–C) Normalized light sensitivity plots of light-adapted WT (A; n = 9) and mutant (B; n = 11) larvae, and dark-adapted WT (n = 8) and mutant (n = 5) larvae (C) at 7 dpf, fitted by the Naka-Rushton function (see Materials and Methods). Normalized peak amplitudes in the dark-adapted mutants were further normalized to wild type (C). (D–F) Representative incremental flash ERG traces from WT (D) and mutant (E) larvae. Dark-adapted larvae were presented two 20 ms test flashes (blue traces; 9.6 μJ/cm2, nearly saturated peak amplitude) prior to the onset of continuous background illumination (121 μJ/cm2 s) followed by 20 test flashes at 30 s intervals. WT (D, black) and mutant (E, red) traces are ERG signals generated by flashes delivered 60, 150, and 420 s after background onset. The dashed line indicates the delay in the onset of recovery in the mutant. (G) Reduction of a-wave amplitudes in dark-adapted gr s357 mutants. In these experiments, the b-waves were pharmacologically suppressed by bathing the fish in L-APB (1 mM, pH 7) for 60 min before recording. Peak photocurrents were reduced in the mutant (n = 9) at light intensities greater than log unit = -4.7. Threshold (at log unit = -5.64) of the photoresponse was not affected. Sibling larvae (n = 14; 9 heterozygotes and 5 homozygous WT) did not show significant differences over the light intensities tested. Bars: SEM. Light intensity was 81 mW/cm2 at log unit = 0.

