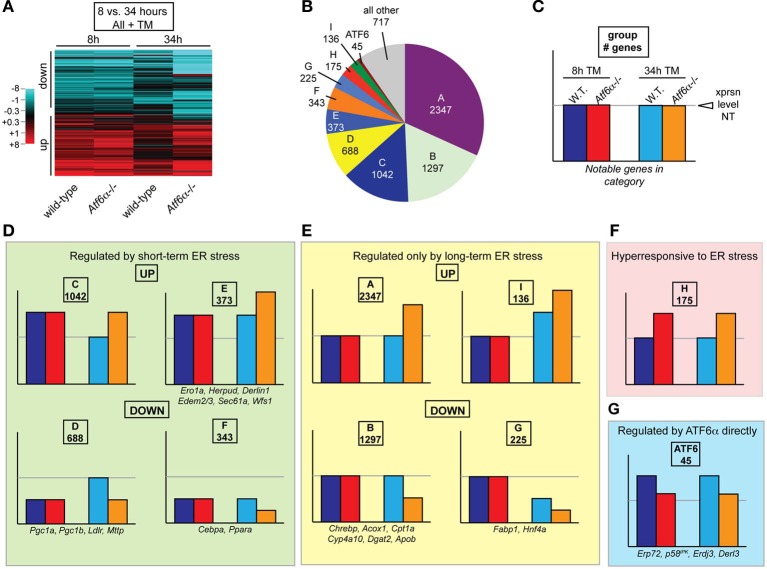
Figure 4.
Clustering of genes according to temporal regulation in wild-type and Atf6α−/− animals. (A) The expression of every probeset on the Affymetrix microarray described in Figure 3 was aggregated with expression data from a previously published identical array comparing gene expression in wild-type and Atf6α−/− animals 8 h after challenge with vehicle or 2 mg/kg TM (Rutkowski et al., 2008). For each time point, expression was determined using a log2 scale relative to vehicle-treated wild-type animals at that time point. Only probesets showing significant (p < 0.05) expression differences (1.5-fold, or ±0.58 on the log2 scale) in one or more of the four of the four conditions (wild-type or Atf6α−/− at 8 or 34 h) are shown by heatmap, which accounted for ~7000 of the ~45,000 probesets on the array. Extent of up- or downregulation is shown by intensity of red or blue coloration, respectively. Each column depicts expression level averaged among the three animals per group. (B,C) Every probeset on the array was characterized by its expression in the following four ways, with differences defined as > 1.5-fold, p < 0.05: (1) up, down, or unchanged in wild-type TM-treated animals at 8 h relative to vehicle-treated wild-type; (2) up, down, or unchanged in Atf6α−/− TM-treated animals at 8 h relative to TM-treated wild-type; (3) same as (1) but 34 h; and (4) same as (2) but 34 h. The genes that showed a difference by criterion (4) were broken down into groups based on their behavior with respect to these criteria, and the number of genes in the nine most populated groups is shown in (B). The group of genes that were upregulated by ER stress in wild-type animals at both time points, but were less upregulated in Atf6α−/− animals—i.e., genes that could be understood as directly ATF6α-dependent—is also accounted for. (C) provides a key for illustration of gene expression patterns. (D–G) Expression pattern for each of the gene groups shown in (B). These include genes shown in Figure 2 (those that did not fall into one of these groups are illustrated in Figure S1) as well as genes involved in ER protein processing found in Group E. For genes represented by more than one probeset, the behavior most commonly represented and/or most consistent with qRT-PCR data is shown.

