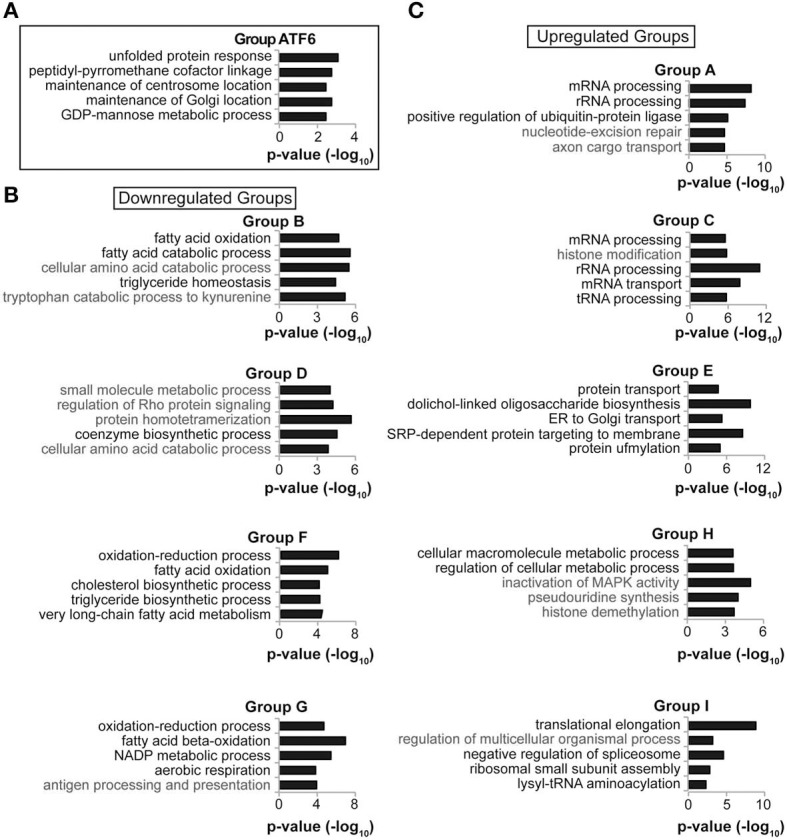
Figure 5.

Functionally related genes cluster by temporal regulation. (A–C) Each of the gene groups in Figure 4 was subjected to Gene Ontology pathway analysis using FunNet. The top seven most significant pathway enrichments were then reordered by the number of genes from that group that were pathway “hits,” with pathways having the most “hits” listed higher. For reasons of space, five of these seven pathways from each group are shown. In no case was a lipid metabolism process enriched among the upregulated gene groups. In (B), pathways relevant to lipid metabolism are listed in black, and other pathways in gray. In (C), pathways relevant to protein processing are listed in black.
