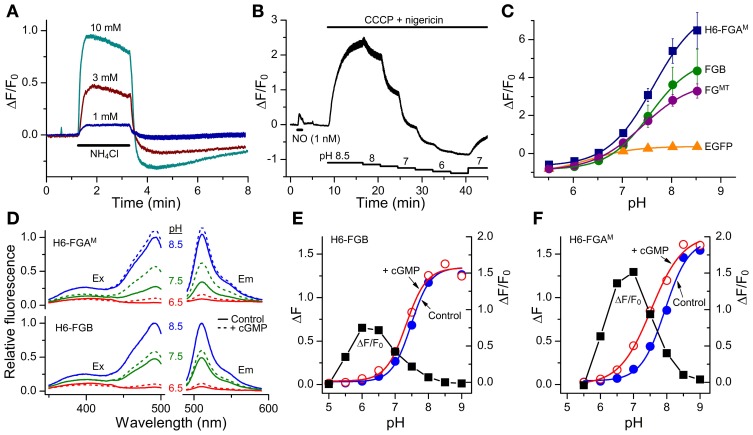
Figure 5.
Sensitivity of FlincG variants to pH. (A) Responses of HEKGC/PDE5 cells expressing FGB to 2-min applications of NH4Cl (horizontal bar). Traces are means from 40 cells; vertical bars are ± SEM. (B) HEKGC/PDE5 cells expressing FGB were initially stimulated with NO (1 nM; 1 min), after which the combination of CCCP (20 μM) and nigericin (10 μM), which results in an equalization of intracellular and extracellular pH, was superfused at different pH values (as indicated by the stepped horizontal bars below). The trace is the average of 10 cells; vertical bars are ± SEM. (C) Summary pH titration data obtained as in panel (B) on HEKGC/PDE5 cells expressing different FlincGs or EGFP (n = 3). (D) Sample excitation (Ex) and emission (Em) spectra of purified H6-FGAM and H6-FGB proteins in the absence (solid lines) or presence (dashed lines) of 100 μM cGMP, at pH 6.5 (red), 7.5 (green) and 8.5 (blue), normalized to the peak at pH 8.5 in the absence of cGMP. (E,F) pH-titration data for the fluorescence (arbitrary units) of the purified FlincG proteins in the absence and presence of 100 μM cGMP (left-hand ordinate), and the dynamic ranges, expressed as ΔF/F0, at each pH (black squares; right-hand ordinate).

