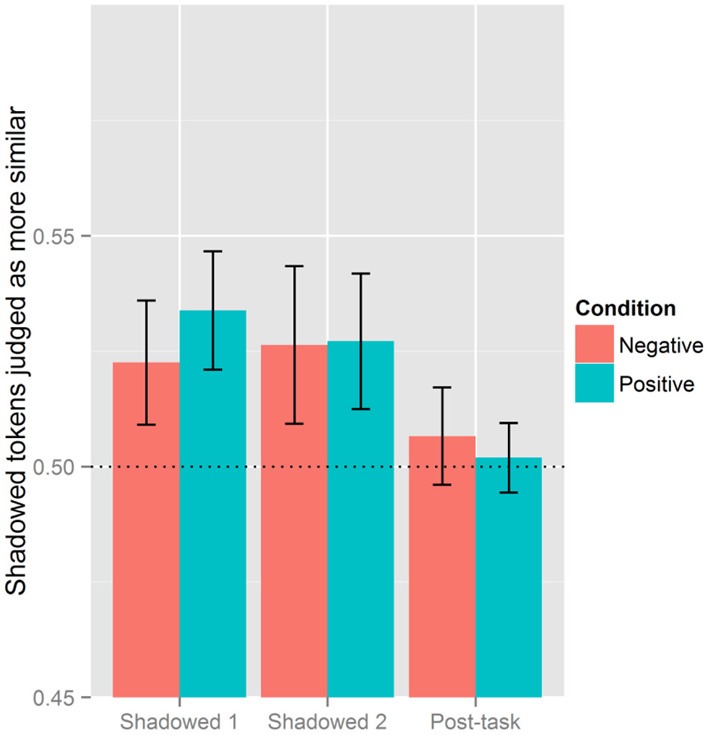
Figure 3.

Effect of block and condition. The vertical axis is the proportion of post-exposure tokens judged as more similar to the model. Proportions above 0.5 indicate that Shadowed or Post-task tokens are more judged to be more similar to the model, while values below 0.5 means baseline tokens were more likely to be judged as similar to the model's production. The line at 0.5 serves to indicate chance levels.
