
Table 4.
Adult Inpatients with Stable Chronic Kidney Disease Who Met One or More eGFR Threshold Levels and One or More SCr Threshold Levels before Diagnostic CT Examinations of Any Type: Stratification Beginning with eGFR
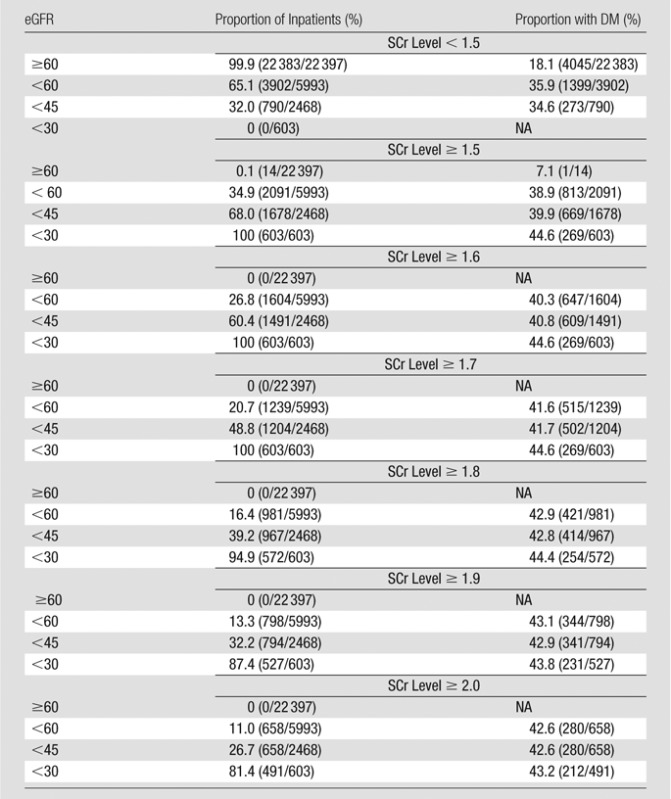
Note.—The SCr level was measured in milligrams per deciliter, and the conversion factor for Système International units is given in Table 1. The eGFR was measured in milliliters per minute per 1.73 m2. The proportion of inpatients refers to the proportion of inpatients at that eGFR level. The denominator of each percentage is based on the total number of patients who met each eGFR threshold level (Table 1). Numbers in parentheses were used to calculate the percentages. DM = type 1 or 2 diabetes mellitus, NA = not available.