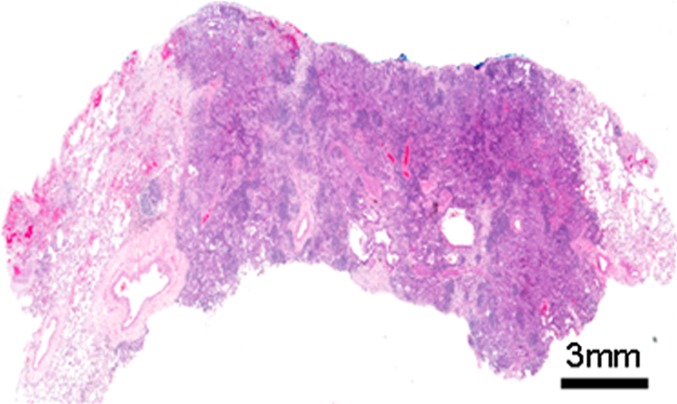
Figure 1c:

(a) Computed tomographic (CT) scan of right upper lobe lung cancer in a 50-year-old woman. (b) Isoattenuation map shows regional heterogeneity at the tissue scale (measured in centimeters). (c, d) Whole-slide digital images (original magnification, ×3) of a histologic slice of the same tumor at the mesoscopic scale (measured in millimeters) (c) coupled with a masked image of regional morphologic differences showing spatial heterogeneity (d). (e) Subsegment of the whole slide image shows the microscopic scale (measured in micrometers) (original magnification, ×50). (f) Pattern recognition masked image shows regional heterogeneity. In a, the CT image of non–small cell lung cancer can be analyzed to display gradients of attenuation, which reveals heterogeneous and spatially distinct environments (b). Histologic images in the same patient (c, e) reveal heterogeneities in tissue structure and density on the same scale as seen in the CT images. These images can be analyzed at much higher definition to identify differences in morphologies of individual cells (3), and these analyses reveal clusters of cells with similar morphologic features (d, f). An important goal of radiomics is to bridge radiologic data with cellular and molecular characteristics observed microscopically.
