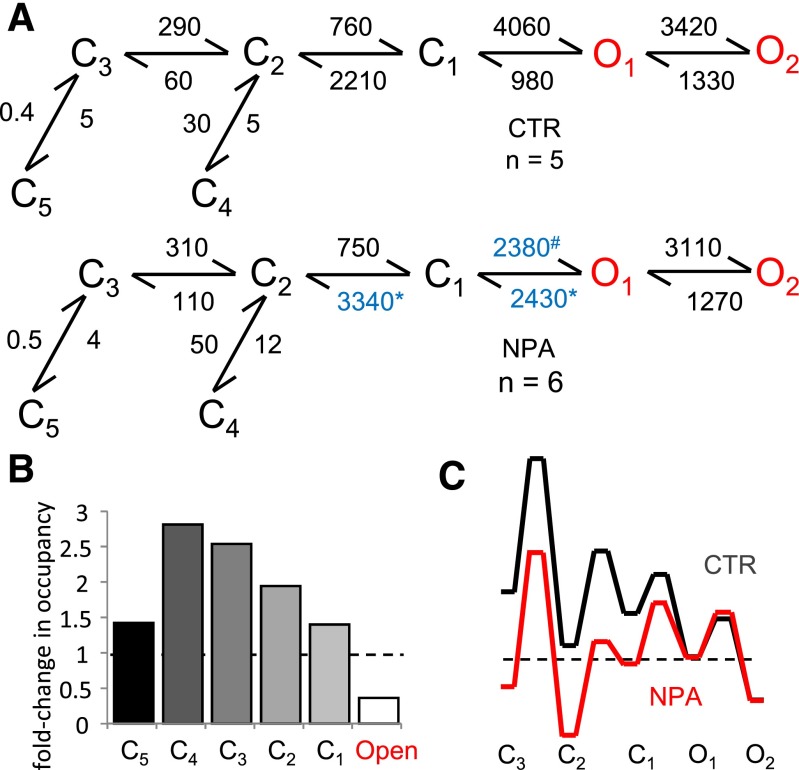
Fig. 4.
Kinetic mechanism of N1/N2A inhibition by NPA. (A) Reaction mechanisms for NPA-free (CTR) and NPA-bound N1/N2A receptors (NPA); rate constants for the steps explicitly incorporated in the model were estimated from fits to one-channel records and are given in s−1 as averages for the records in each data set; blue denotes rate constants that are significantly different. All states represent receptor conformations fully bound with glutamate and glycine. (B) State-occupancy changes calculated from the reaction mechanisms in A. (C) Relative free-energy fluctuations during gating were calculated with the rate constants in A; desensitized states (C4 and C5) are omitted for simplicity; profiles are arbitrarily aligned at O2. C, nonconductive; O, conductive. *,#P < 0.05, Student’s t test, for differences among rate constants (*increase or #decrease).

