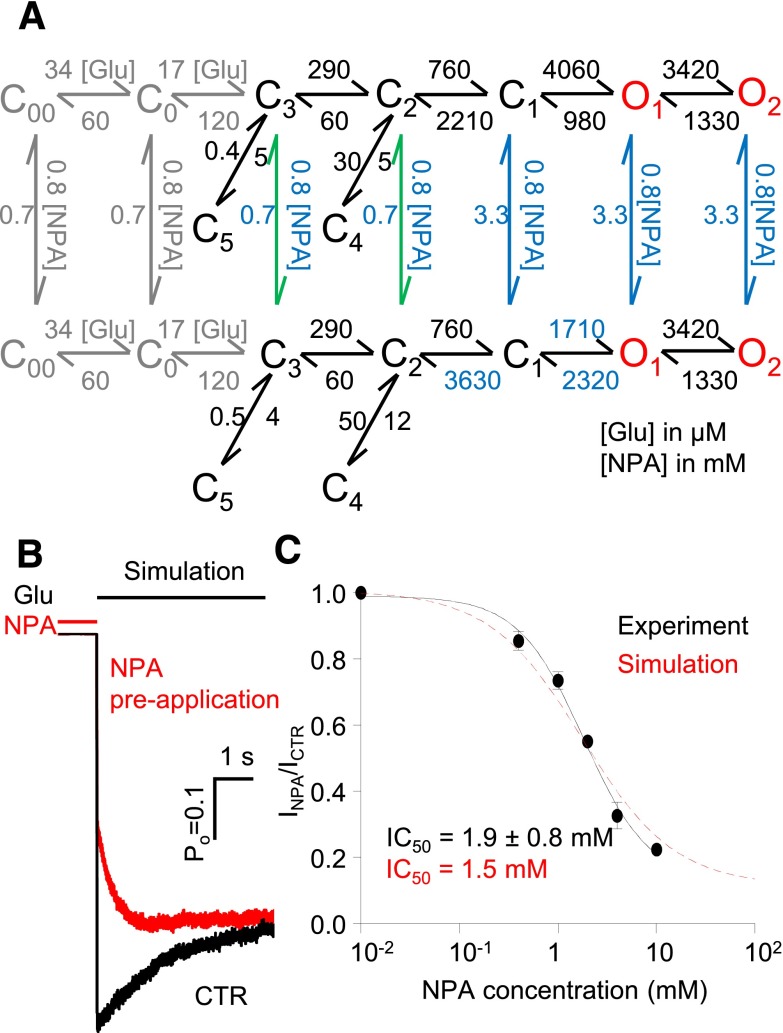
Fig. 6.
Kinetic mechanism of N1/N2A inhibition by NPA. (A) Tiered model with transitions allowed at all states except C4 and C5. Rate constants shown in blue are allowed to vary. The on-rates for all closed states were fixed for the values shown, while the off-rates from C1, O1, and O2 (blue) were scaled as 5-fold of those from C2 and C3 (green). This model was fitted to data obtained at 4 mM NPA (n = 6) and also used for simulations. The glutamate binding steps used for simulation are shown (gray). (B) Macroscopic responses to a long (5-second) pulse of 1 mM Glu (black line) were simulated, and agreed well with whole-cell currents as shown in Fig. 5B. (C) The simulated dose-inhibition curve (red) was compared with the whole cell data (IC50 is expressed as 95% confidence interval). Hill slope was 1.0 for simulations and 1.2 for experimental traces.

