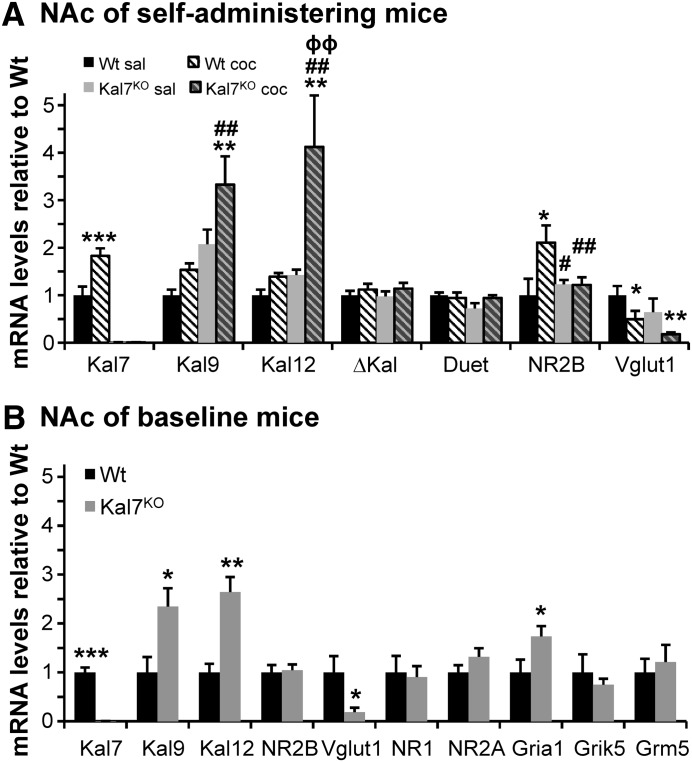
Fig. 6.
Results of qPCR. (A) RNA prepared from the NAc of cocaine and saline self-administering Wt and Kal7KO mice was subjected to qPCR analyses with data averaged across all sets of experiments and expressed with respect to internal GAPDH values. For ease of viewing, all transcripts are graphed as fold-change from Wt saline; statistical analyses and expression levels are provided in Table 1. Kal7, Kal9, and Kal12 reflect the use of different 3′-untranslated regions; ΔKal and Duet measure transcripts derived from alternate promoters. Cocaine self-administration results in an increase in NAc levels of NR2B transcript in Wt mice, but not in Kal7KO animals; Vglut transcript levels decline in response to self-administered cocaine in both genotypes. No significant changes with genotype or drug treatment are seen for a number of other transcripts known to be regulated by experimenter-administered cocaine (Eipper-Mains et al., 2013): NR1, NR2A, Gria1, Grik5, Grm5, Drd1a, Drd2, Mef2A, Arhgap32, Ppp1r1b (not shown). Symbols represent Holm-Sidak post-hoc results following two-way ANOVAs tabulated in Table 1. *Significant compared with Wt-Sal; #Significant compared with Wt-Coc; ϕSignificant compared with KO-Sal. (B) Comparison of NAc gene expression in naïve male Wt and Kal7KO mice; data are plotted as fold-change from Wt. *Significant compared with naïve Wt NAc. For both A and B: one symbol *,#P < 0.05; two symbols **,##,ϕϕP < 0.01; three symbols ***P < 0.001.

