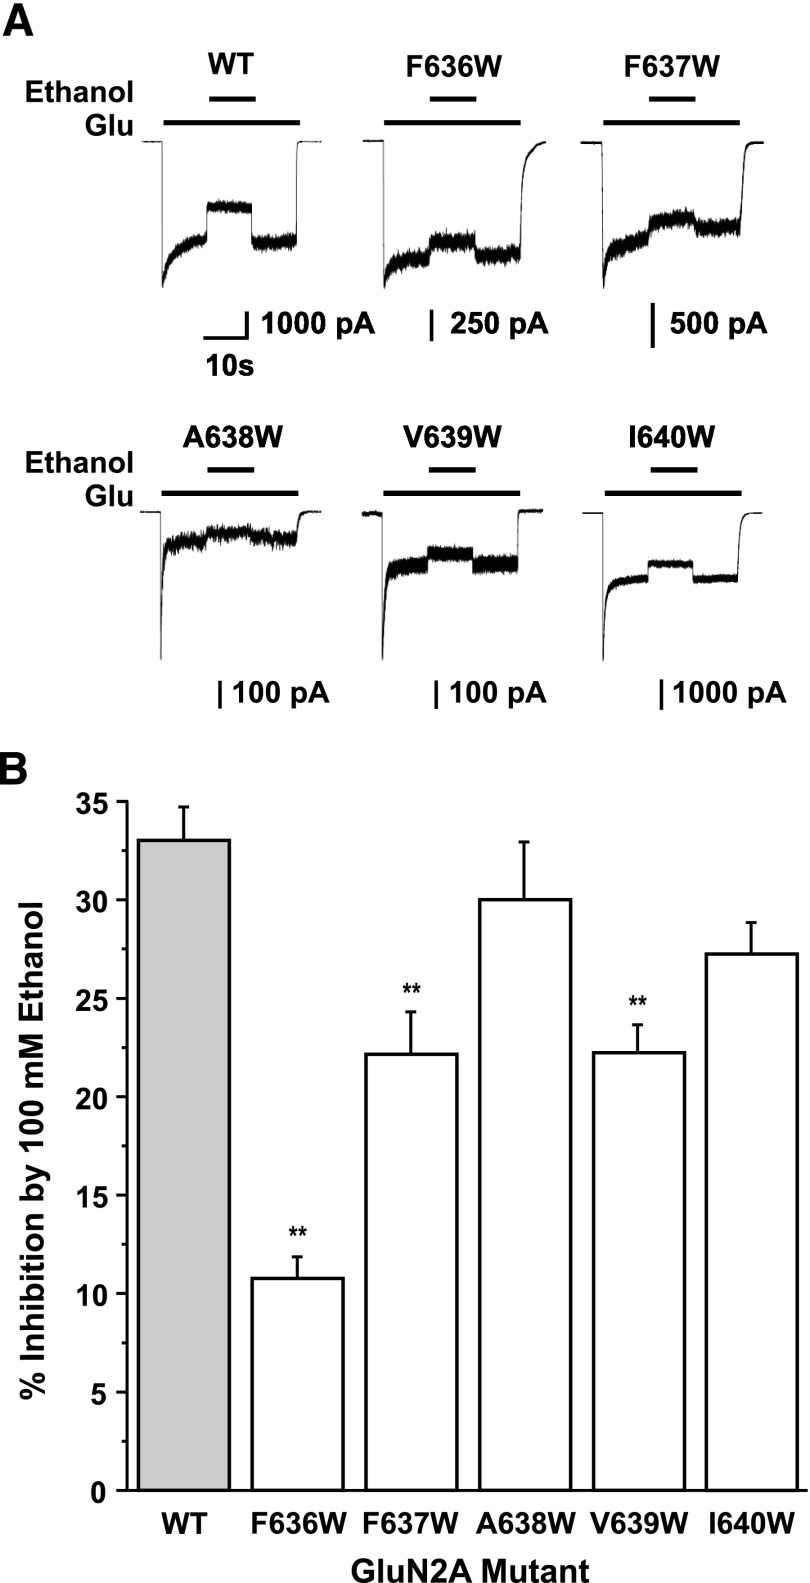
Fig. 2.
Comparison of ethanol sensitivity among tryptophan substitution mutations at positions from F636 to I640 in M3 of the GluN2A subunit. (A) Traces are currents activated by 10 µM glutamate and 50 µM glycine and their inhibition by 100 mM ethanol in cells expressing GluN1 and wild-type (WT) GluN2A subunits or GluN2A subunits containing tryptophan substitution mutations at positions from F636 to I640. One-letter amino acid codes are used. (B) Bar graph shows the average percentage of inhibition by 100 mM ethanol of glutamate-activated current in cells expressing GluN1 and WT GluN2A subunits or GluN2A subunits containing tryptophan substitution mutations at positions from F636 to I640. Asterisks indicate values that are statistically significantly different from the WT GluN1/GluN2A subunit value (**P < 0.01; one-way ANOVA and Dunnett’s test). Results are mean ± S.E. of 5–12 cells. Values for WT and GluN2A mutants F636W and F637W are from Ren et al. (2012).

