
Fig. 4.
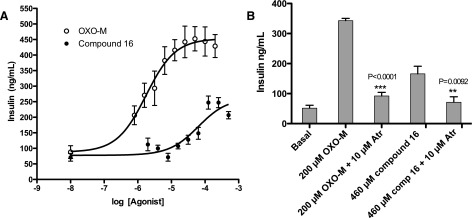
Ligand-stimulated insulin release in MIN6 cells. (A) MIN6 cells, which express endogenous M3 receptors, were incubated with increasing concentrations of OXO-M and compound 16, and ligand-induced insulin release was measured. (B) The responses to both agonists were sensitive to blockade by atropine, indicating that the observed effects result from direct M3 receptor activation. Data (mean ± S.E.) are from three independent experiments: OXO-M pEC50 = 5.75 ± 0.17; Emax = 453 ± 21; compound 16 pEC50 = 4.21 ± 0.18; Emax = 261 ± 21. Atr, atropine; comp, compound. **P < 0.0092; ***P < 0.0001.