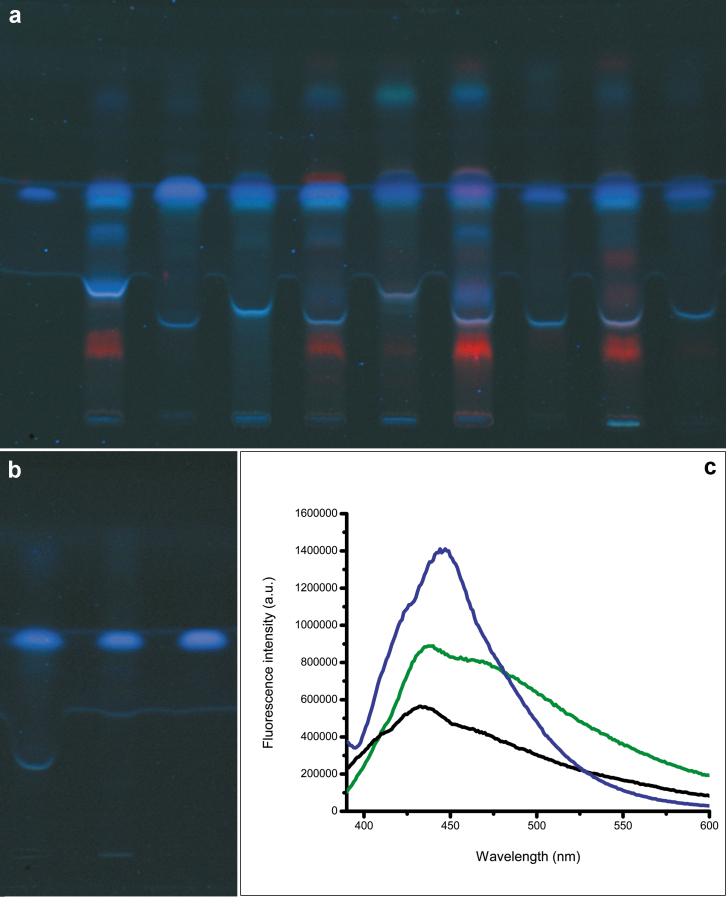
Figure 2. HPTLC profiles of blue and red metabolites in the leaves and reproductive structures of grasses at UV 366 nm, fluorescence emission spectra.
(a) Tracks (left to right) (t1) FA standard, (t2) Zea mays leaves, (t3) Z. mays internal bracts, (t4) Z. mays male flower, (t5) Oryza sativa leaves, (t6) O. sativa spikelet, (t7) Ochlandra travancorica leaves, (t8) O. travancorica spikelet, (t9) Bambusa pallida leaves and (t10) B. pallida spikelet. (b) Tracks (left to right) (t1) T. aestivum seed extract, (t2) FA (isolated) and (t3) FA (standard). (c) Fluorescence emission spectra of T. aestivum seed extract (green), isolated FA (black) and standard FA (blue) at an excitation λ 366 nm.

