
Fig. 7.
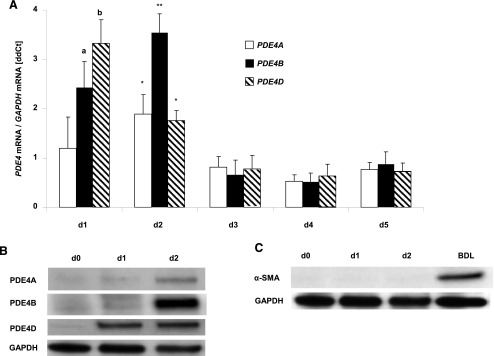
(A) PDE4 expression in isolated HSCs. Primary rat HSCs were isolated and plated to let them differentiate on plastic. PDE4A, B, and D mRNA levels were examined every day during culture-activation by real-time PCR. Data obtained from at least three independent preparations per time-point is shown and presented as mean ± S.D. *P < 0.05; **P < 0.01 compared with day 3. aP < 0.05; bP < 0.01 as compared with day 2. (B) PDE4A, B, and D protein levels in HSCs (d0, freshly isolated HSCs; d1, 1 hour after attachment of the cells; d2, 24 hours after plating). (C) α-SMA protein levels. BDL, liver lysate from BDL; 2w, as a positive control.