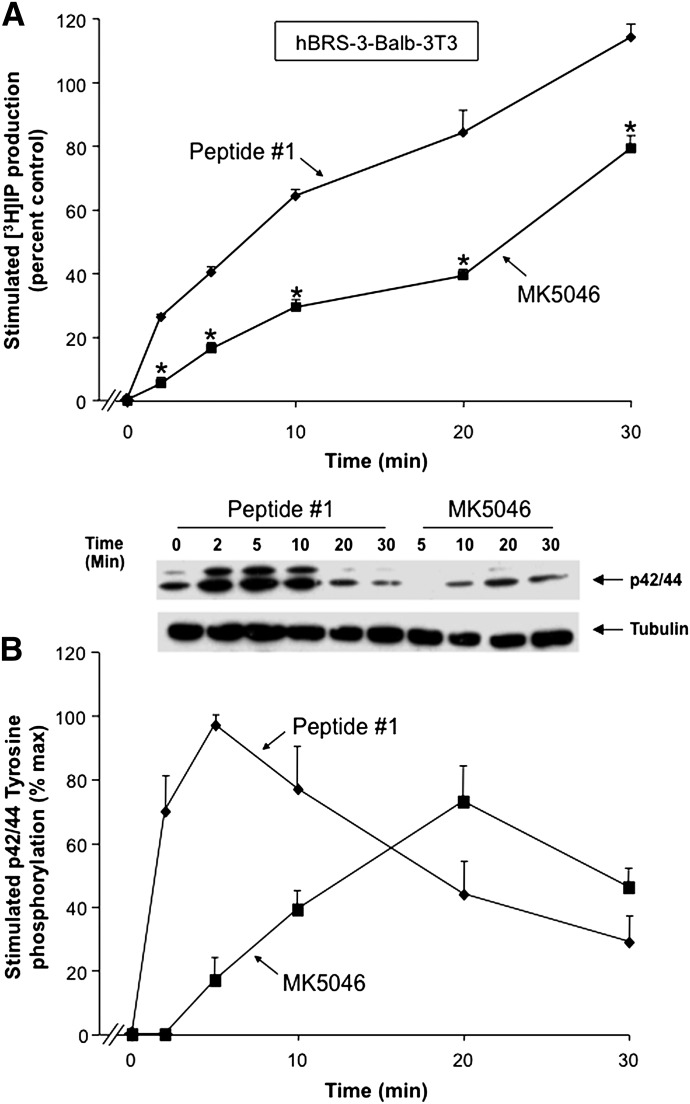
Fig. 12.
Time course of peptide #1 and MK-5046 stimulation of [3H]IP production and p42/44 MAPK phosphorylation in hBRS-3 Balb 3T3 transfected cells. (A) Maximal concentration of the agonists peptide #1 (10 nM) and MK-5046 (100 nM) to stimulate [3H]IP generation. The experiment was performed as described in Fig. 3 and under Materials and Methods, and the results are expressed as the percentage of control over basal stimulation. (B) Representative Western blot of p42/44 MAPK phosphorylation in Balb/hBRS-3 cells, and results of the experiment performed as described in Fig. 8 and under Materials and Methods. The concentrations are the same as in A. The results are expressed as the percentage of maximum stimulation caused by a maximal effective concentration of peptide # 1 (10 nM). The results in both panels are the mean ± S.E.M. from at least four experiments, and in each experiment the data points were determined in duplicate. *P < 0.05 versus peptide #1.

