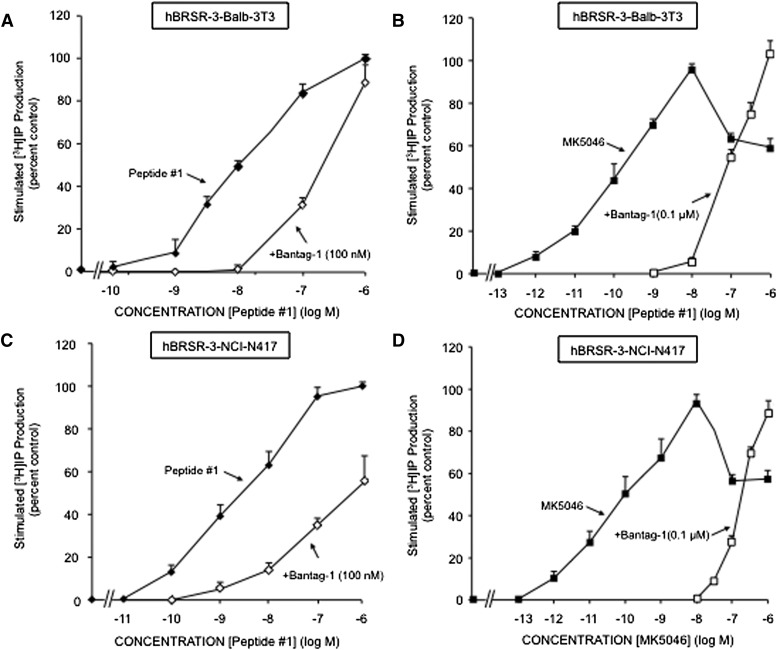
Fig. 6.
Bantag-1 alters the dose-response curves of peptide #1 and MK-5046 stimulated [3H]IP in cells containing hBRS-3. (A and C) Effect of the antagonist Bantag-1 (100 nM) on the dose-response curve of peptide #1 for stimulating [3H] production. The results are expressed as the percentage of stimulation caused by a maximal effective concentration of peptide #1 (100 nM) alone. (B and D) Effect of Bantag-1 (100 nM) on the dose-response curve of MK-5046 for stimulating [3H] production. The results are expressed as the percentage of stimulation caused by the maximal effective concentration of MK-5046 (100 nM) alone.

