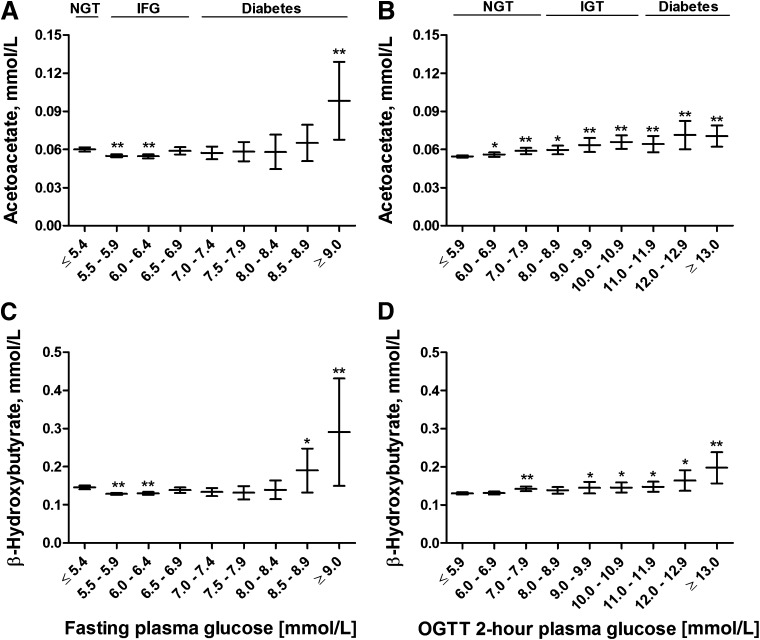
FIG. 1.
Mean values and their 95% CIs of fasting levels of AcAc (A and B) and BHB (C and D) across the fasting and 2-h glucose categories. P values (from ANOVA post hoc tests) indicate statistical significance with respect to the reference category (FPG ≤5.4 mmol/L and 2hPG ≤5.9 mmol/L). *P < 0.05; **P < 0.01. OGTT, oral glucose tolerance test.

