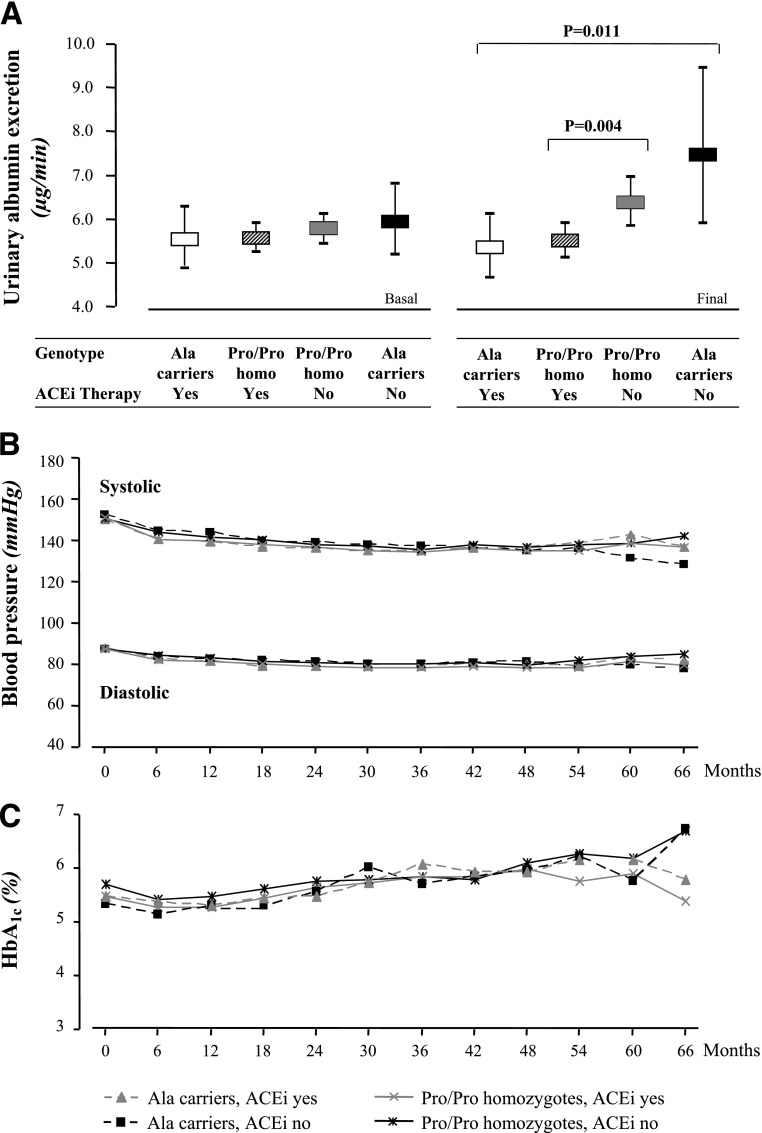
FIG. 4.
UAE rate, BP, and HbA1c according to Pro618Ala polymorphism and ACEi therapy. A: UAE rate (geometric mean and 95% CI) at basal and final visit. B: Mean SBP and DBP. C: HbA1c throughout the whole observation period. Differences in UAE rate between treatment groups are adjusted for baseline values by ANCOVA. Differences in BP and HbA1c between different groups are not significant.

