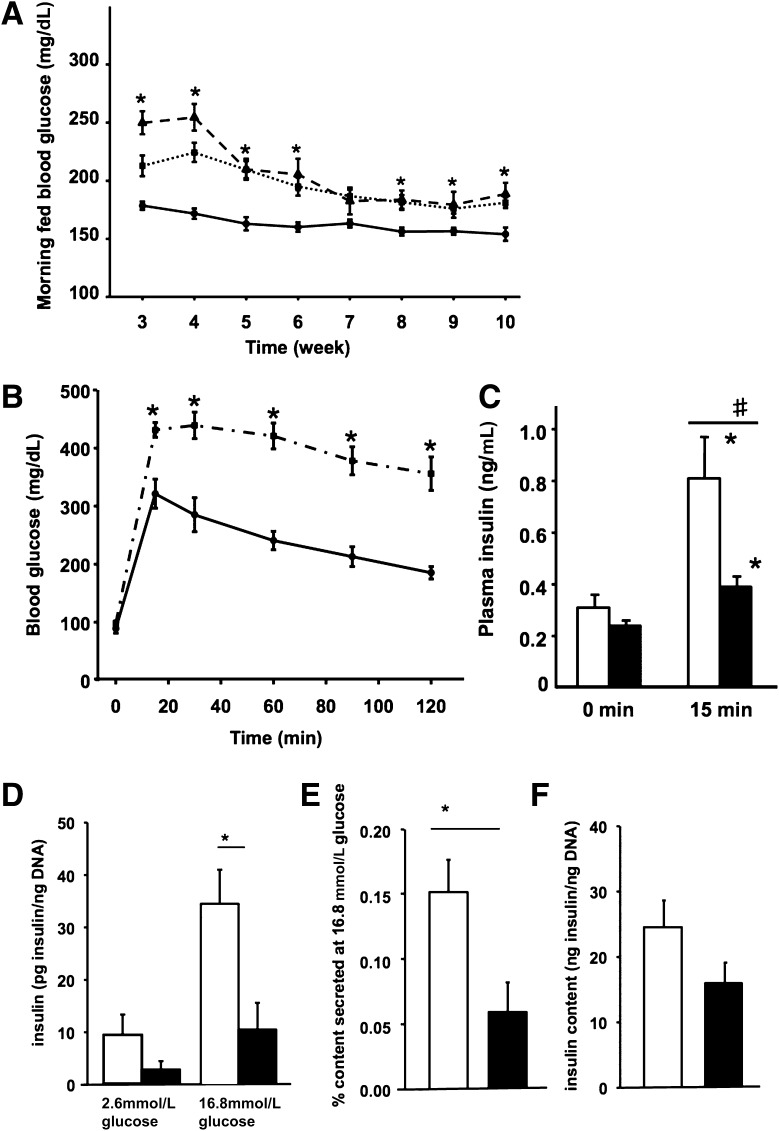
FIG. 3.
Duct-specific Pdx1-deficient mice had impaired glucose tolerance and impaired insulin secretion. A: Time course of morning fed blood glucose values of the controls (solid line, n = 33), CAIICre;Pdx1Fl/Fl (dashed line, n = 17), and CAIICre;Pdx1Fl/+ (dotted line, n = 23) littermates. Only at 3 and 4 weeks did the two bigenic genotypes differ from each other. B: Intraperitoneal glucose tolerance test (IPGTT) in 10-week-old animals comparing control (solid line) and bigenic mice (CAIICre;Pdx1Fl/Fl and CAIICre;Pdx1Fl/+, dashed-dotted line; n = 8–16) showed impaired glucose tolerance. C: Plasma insulin levels from the IPGTT showed significant increases in both groups at 15 min after glucose injection compared with fasting at 0 min in controls (□, n = 4) and bigenic (■, n = 9). *P < 0.025 compared with 0 min. #P < 0.004 comparing groups at 15 min. D–E: Isolated islets from 11-week-old bigenic mice (both CAIICre;Pdx1Fl/Fl and CAIICre;Pdx1Fl/+, ■, n = 10 animals) in sequential static incubation had impaired glucose-responsive insulin secretion compared with controls (□, n = 10 animals) (D) and lower percentage insulin content secreted (E) even though the islet insulin content was not significantly different (F). Data are mean ± SEM. *P < 0.007. Even if each islet aliquot with values for both glucose concentrations (n = 23 for bigenic and n = 26 for control) was used for the averaging, the basal levels and islet insulin content do not differ, but the bigenic islets showed a modest glucose-stimulated insulin release (2.6 mmol/L glucose: 3.6 ± 1.1 pg insulin/ng DNA; 16.8 mmol/L glucose: 12.5 ± 3.6 pg insulin/ng DNA; P < 0.003, paired t test).

