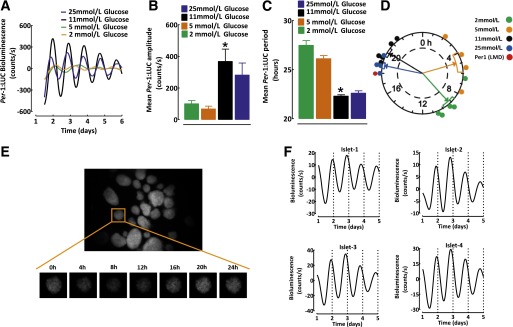
FIG. 2.

Continuous longitudinal monitoring of the islet circadian clock using Per-1:LUC rats. A: Representative examples of Per-driven diurnal bioluminescence rhythms in batches of 50 islets isolated from Per-1:LUC rats cultured in standard islet media for 7 days at 2 (orange), 5 (green), 11 (black), or 25 mmol/L (blue) glucose concentrations. Corresponding mean amplitude (B) and period (C) of Per-driven diurnal bioluminescence rhythms in islets isolated from Per-1:LUC rats cultured for 7 days at 2, 5, 11, or 25 mmol/L glucose concentrations (n = 4–5 per condition). D: Rayleigh vector plot with individual time points representing the timing of the peak Per-1:LUC expression relative to the 24-h day LD cycle (n = 4–5 independent experiments) in batches of 50 islets cultured at 2, 5, 11, and 25 mmol/L glucose concentrations. Rayleigh vector plots were used to assess the significance of phase clustering of peak phases of Per-1 expression in relation to circadian time. Each filled circle indicates the phase (time) of peak Per-1:LUC bioluminescence in individual cultures of isolated islets under various glucose levels. The direction of an arrow indicates the mean phase vector and its length indicates the significance relative to P < 0.05, with the significance threshold indicated by the inner broken circle. The rectangular boxes surrounding arrowheads show variance (SE) of phase between individual experiments. Note that the peak Per-1 mRNA expression obtained through laser microdissection of islets (described in Fig. 1) is shown (red circle) to reflect the phase of Per-1 diurnal oscillations in vivo. E: Whole-field image (original magnification ×10) of islets isolated from Per-1:LUC transgenic rats under standard LD condition taken by intensified charge-coupled device camera. An individual islet image was collected over 24 h from the islet in the orange square in the figure. F: Examples of corresponding Per-driven bioluminescence rhythms obtained from four individual islets shown in E isolated from Per-1:LUC rats under the standard LD cycle cultured in 11 mmol/L glucose. Note the robust in-phase oscillations among individual islets. Data are expressed as mean ± SEM. *P < 0.05 denotes statistical significance for 11 vs. 2 and 5 mmol/L glucose. LMD, laser microdissection.
