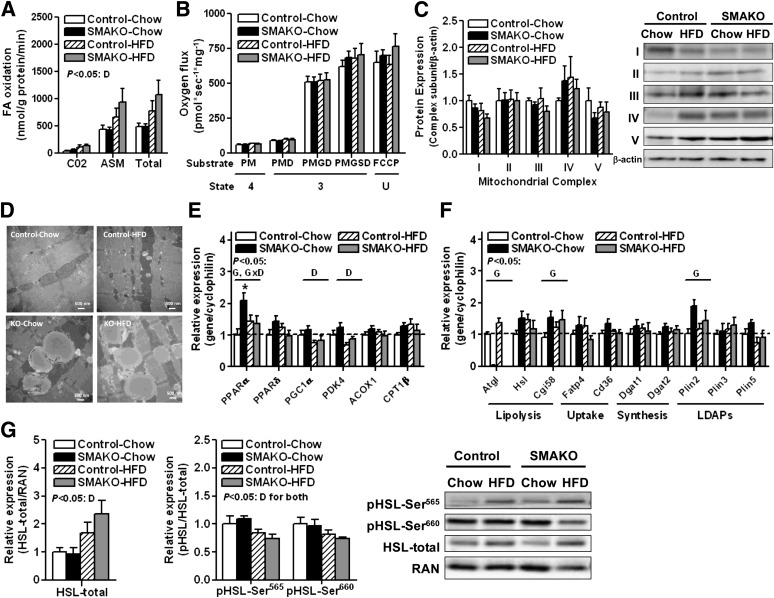
FIG. 3.
Skeletal muscle mitochondrial function and expression of genes/proteins regulating lipid homeostasis in SMAKO mice. A: FA oxidation (♂, 28 weeks, fasted 12 h, red gastrocnemius; n = 6/group). 14C-labeled incorporation into CO2 and acid-soluble metabolites (ASMs) represent complete and incomplete oxidation, respectively. B: Mitochondrial respiration in permeabilized muscle fibers (♂, 28 weeks, fasted 12 h, soleus; n = 6/group). Oxygen consumption was measured following the sequential addition of the following substrates: palmitoylcarnitine (P), malate (M), ADP (D), glutamate (G), succinate (S), and cytochrome c, oligomycin, and carbonylcyanide-p-trifluoromethoxyphenylhydrazone (FCCP). The corresponding respiratory states are noted: ADP-driven respiration (state 3), respiration in the absence of ADP (state 4), and uncoupled respiration (state U). C: Expression of oxidative phosphorylation proteins in complexes I–V (NDUFB8 [complex I], SDHB [complex II], UQCRC2 [complex III], MTCO1 [complex IV], and ATP5A [complex V]) (♂, 28 weeks, fasted 12 h, tibialis anterior; n = 6/group). Data are normalized to protein expression of β-actin. D: TEM of skeletal muscle (♂, 28 weeks, fasted 12 h, red quadriceps, representative images). mRNA expression of PPARα/PGC1α and their target genes (E) and genes for lipid breakdown (lipolysis), uptake, and synthesis as well as lipid droplet–associated proteins (LDAPs) of the Plin family (F) relative to cyclophilin control with expression in WT-chow normalized to 1 (♂, 28 weeks, tibialis anterior; n = 9–13/group). G: Protein expression of total HSL normalized to Ran GTPase (RAN) control (left), phosphorylated HSL normalized to total HSL (middle), and representative immunoblots (right) (♂, 28 weeks, tibialis anterior; n = 4/group). For mRNA and protein expression, samples were confirmed to have low or no expression of Plin1, thereby confirming absence of significant fat contamination. For overall effects having P < 0.05: D, diet; G, genotype. Where an interaction was identified, specific comparisons having P < 0.05: *for effect of genotype.

