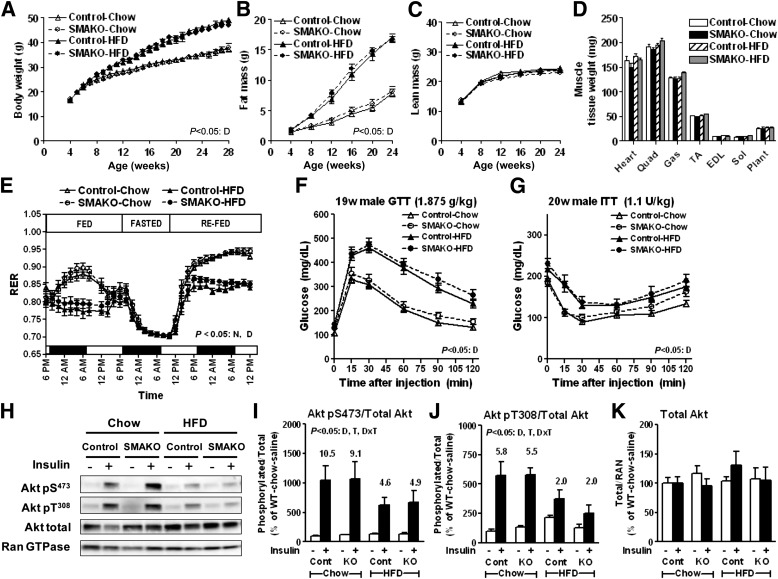
FIG. 4.
Energy/glucose homeostasis and insulin action in SMAKO mice. Body weight (A), fat mass (B), and lean mass (C) (♂, 3–28 weeks; n ≥ 19/group). D: Muscle weights. With the exception of heart, data represent the average weight for both muscles from each mouse (♂, 28 weeks, fasted 12 h; n ≥ 19/group). EDL, extensor digitorum longus; Gas, gastrocnemius; Hrt, heart; Plant, plantaris; Quad, quadriceps; Sol, soleus; TA, tibialis anterior. E: RER using a Comprehensive Lab Animal Monitoring System (CLAMS) (♂, 11 weeks, weight-matched; n = 4/group). F: GTT at 19 weeks with 1.875 g/kg glucose i.p. (♂, fasted 12 h; n = 17–20/group). G: ITT at 20 weeks with 1.1 units/kg insulin i.p. (♂, fasted 4 h; n = 17–20/group). H–K: Insulin signaling studies: mice were fasted for 12 h, injected i.p. with saline or insulin at 10 units/kg body weight, and killed 10 min thereafter (♂, 28 weeks, tibialis anterior; n = 5–7/group). Representative immunoblots (H) and associated quantification of stoichiometric phosphorylation of Akt pS473/Akt total (I), Akt pT308/Akt total (J), and total Akt/Ran GTPase (RAN) control (K). Fold change in response to insulin treatment is indicated above the black bars. For overall effects having P < 0.05: D, diet; G, genotype; N, nutritional status (i.e., fasting/refeeding); T, treatment (i.e., with insulin). For clarity, only overall effects are shown.

