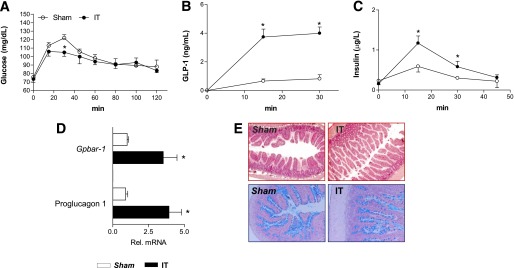
FIG. 1.

IT rats show an improvement in glucose tolerance. OGTT performed at 7 months after the surgical procedure in IT and sham-operated rats after 18 h of food withdrawal (fasting). A: Blood glucose curve. B: Plasma levels of GLP-1. C: Plasma levels of insulin. D: Ileal gene expression of Gpbar-1 and proglucagon 1. Values are normalized relative to Gapdh mRNA and are expressed relative to those of sham-operated rats, which were arbitrarily set to 1. Data are mean ± SE (n = 5 per group). E: Representative hematoxylin-eosin and alcian blue staining of ileal section obtained from sham-operated and IT rats. *P < 0.05 IT vs. sham.
