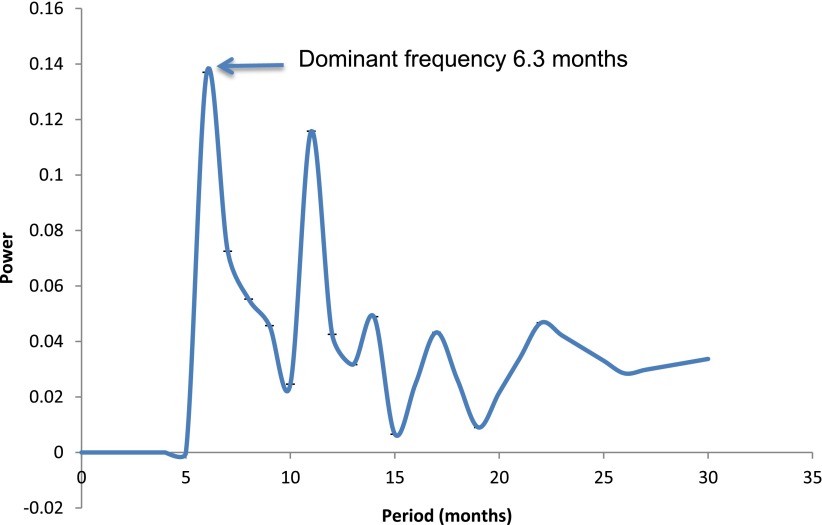
Figure 1.
Fourier analysis of HbA1c values from 1999 to 2012. The x-axis depicts the periodicity (reciprocal of frequency) and the y-axis the strength of the oscillatory signal at different periodicities. The dominant periodicity is the first peak encountered, and the subsequent peaks are subharmonics.

