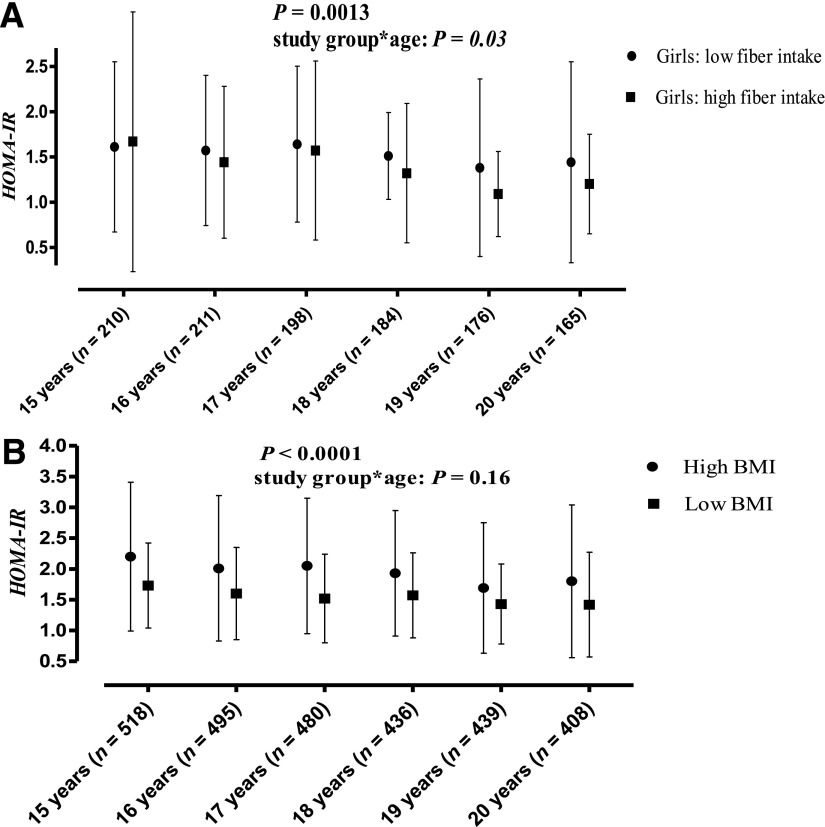
Figure 2.
Median (interquartile range) HOMA-IR in the low (<25%) and high (>75%) dietary fiber intake (g/MJ) groups in girls (A) and in the low and high BMI groups with the sexes combined (B). P values are for the dietary fiber intake, BMI, and study group*age interaction from repeated-measures ANOVA adjusted for age and sex. Dietary fiber intake and BMI were used as continuous variables in the analyses.

