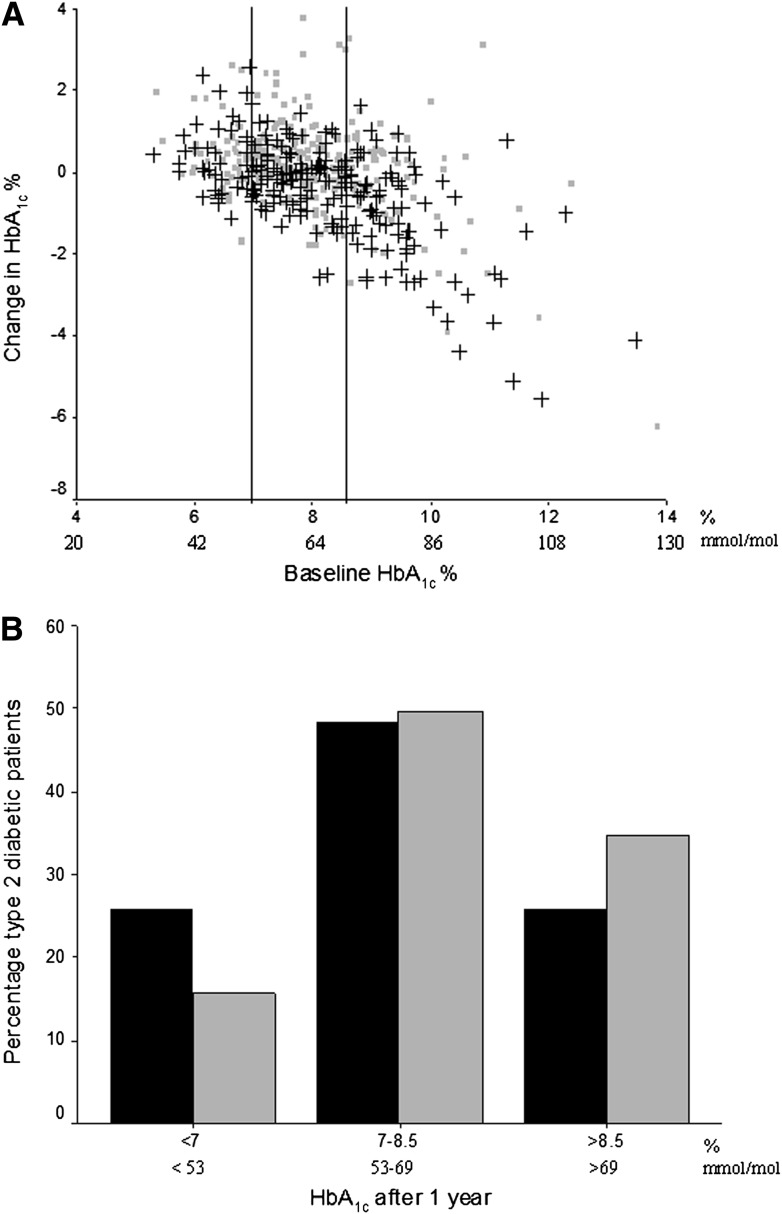
Figure 1.
A: Change in HbA1c at 1 year, according to HbA1c at baseline. Change in HbA1c % in the 506 patients with type 2 diabetes after 1 year of patient-centered (black crosses, n = 237) or usual care (rectangles, n = 269) according to baseline HbA1c %. Vertical black lines represent the different strata: HbA1c <7 (53 mmol/mol), 7–8.5, or >8.5% (69 mmol/mol). B: HbA1c distribution of 506 type 2 diabetic patients at 1-year follow-up. HbA1c distribution of the 506 patients with type 2 diabetes according to HbA1c strata after having received patient-centered (black bars, n = 237) or usual care (gray bars, n = 269) for 1 year.

