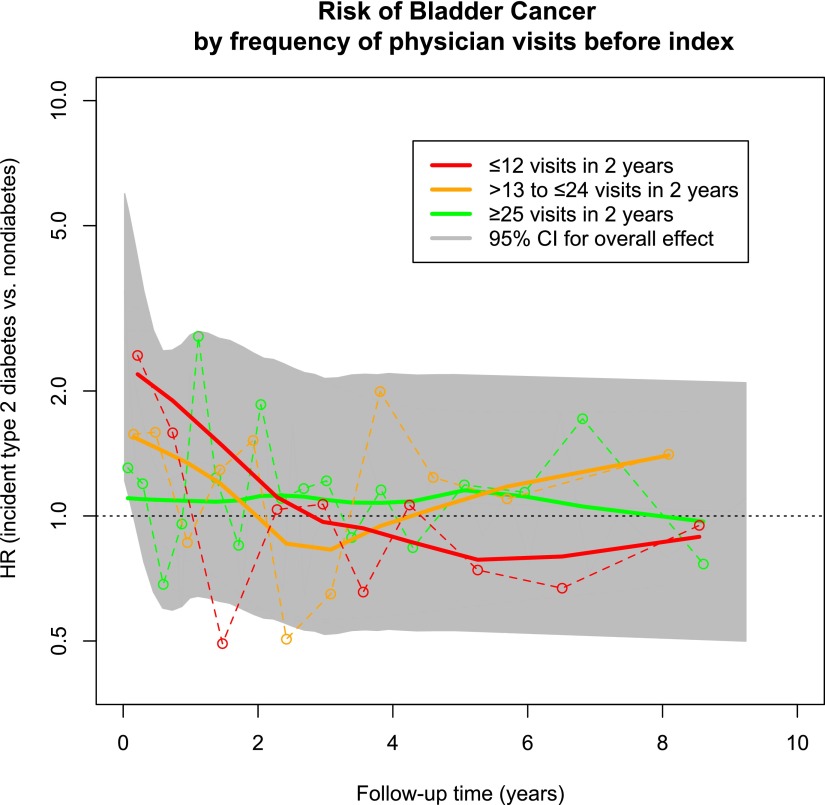
Figure 1.
Risk of bladder cancer by frequency of physician visits 2 years before the index date. Adjusted HRs for each physician visit category (≤12, 13–24, and ≥25 visits) were calculated at multiple points throughout follow-up and plotted (○ connected by dashed line). The time-varying risk of bladder cancer is estimated with the solid trend lines. The 95% CI for the overall (i.e., nonstratified) effect is shaded in gray (trend line for overall risk not shown).

