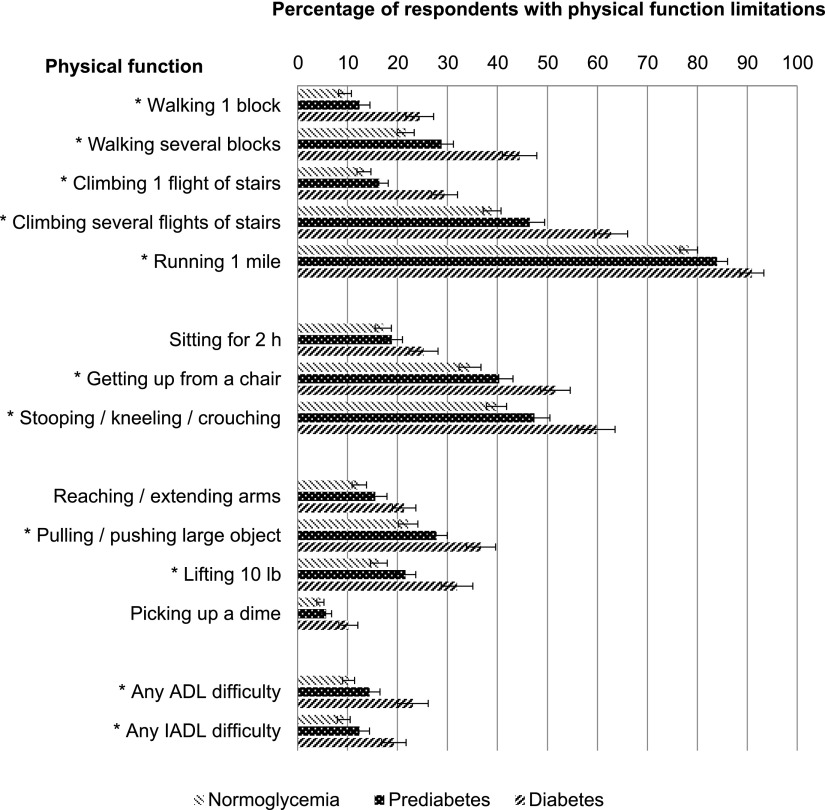
Figure 2.
Prevalence of physical function limitations among U.S. adults ≥53 years of age with normoglycemia, prediabetes, and diabetes. Weighted percentages were derived with the use of HRS respondent population weights to adjust for differential probability of selection into the sample and differential nonresponse. P values are from χ2 test for the association between the indicated variables and the three glycemic groups. SE bars are presented for each physical function. For all physical function items, P < 0.01 when comparing the three glycemic groups and prediabetes vs. diabetes. *P < 0.02 comparing respondents with prediabetes vs. normoglycemia.

