
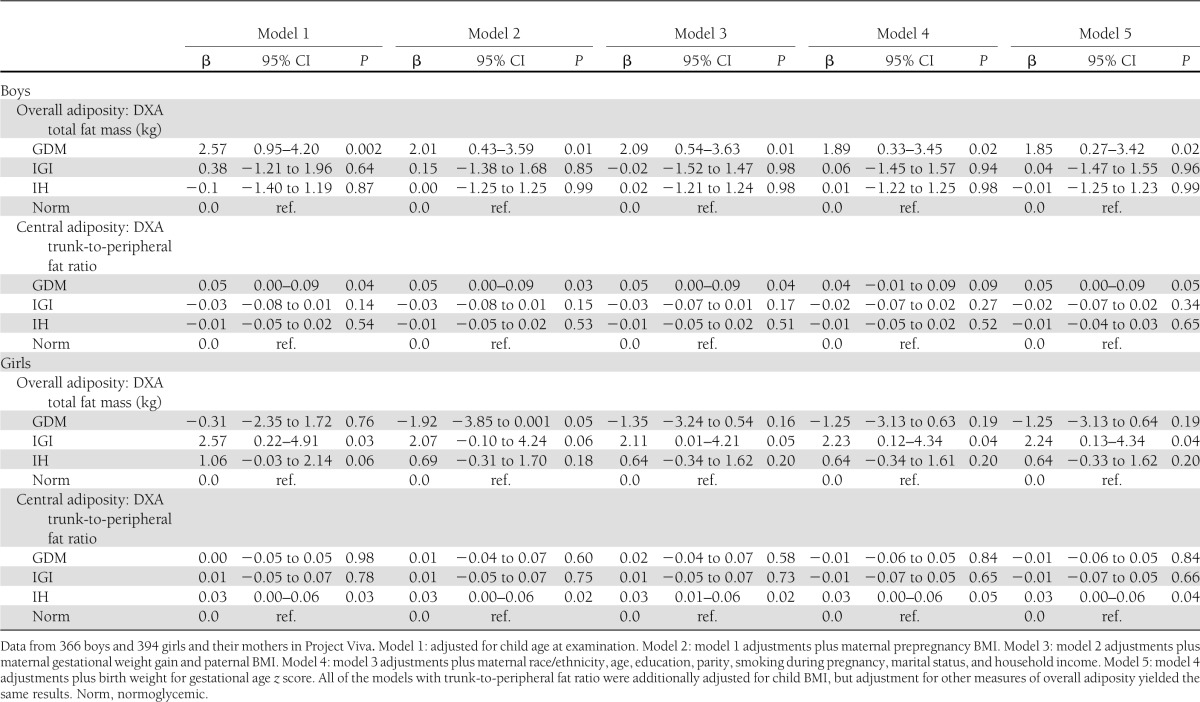
Table 2.
Crude and adjusted regression coefficients (95% CI) for associations of maternal glucose tolerance with total fat mass and trunk-to-peripheral fat ratio, measured by DXA, according to child sex
Official websites use .gov
A
.gov website belongs to an official
government organization in the United States.
Secure .gov websites use HTTPS
A lock (
) or https:// means you've safely
connected to the .gov website. Share sensitive
information only on official, secure websites.
Crude and adjusted regression coefficients (95% CI) for associations of maternal glucose tolerance with total fat mass and trunk-to-peripheral fat ratio, measured by DXA, according to child sex