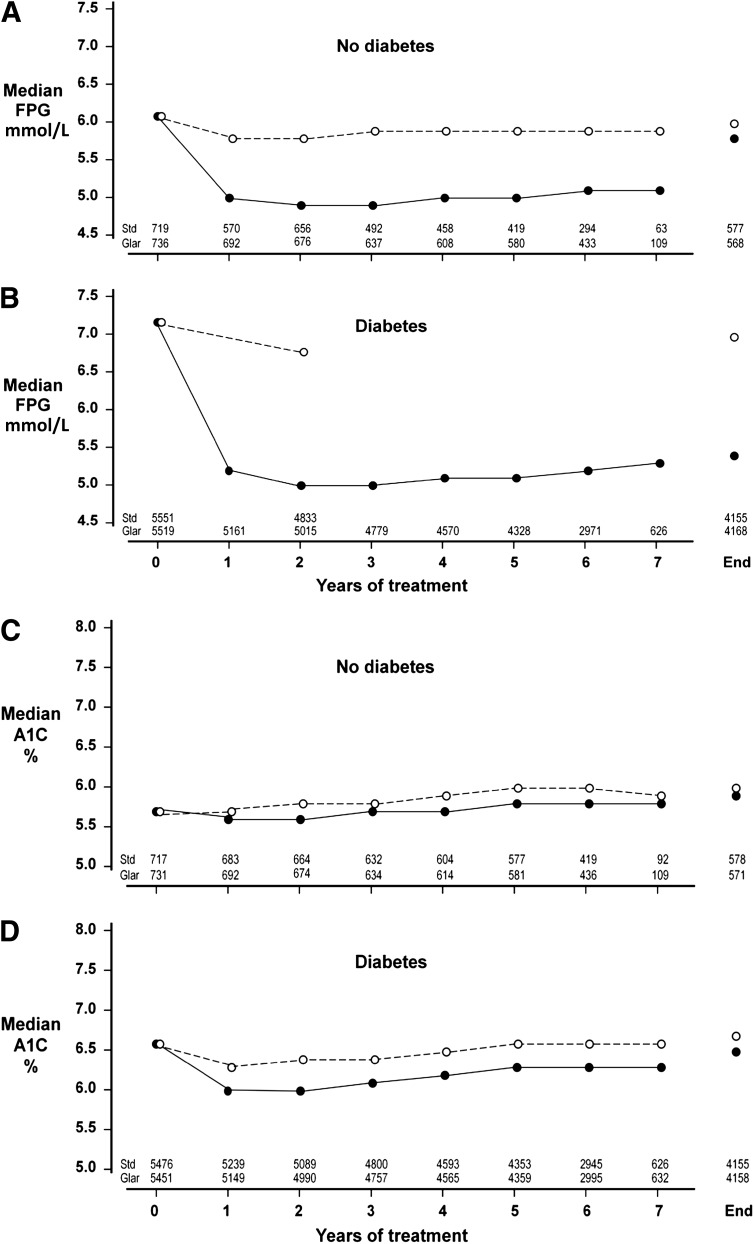
Figure 1.
Median FPG values and median A1C values at baseline, yearly during randomized treatment, and at the end of treatment are shown separately for participants without diabetes (A for FPG, C for A1C) and with diabetes (B for FPG, D for A1C) at baseline. The group assigned to use basal insulin glargine is shown by solid lines and solid circles, and the group assigned to standard care by broken lines and open circles. The numbers at the bottom of each panel show the number of observations included at each point in time.

