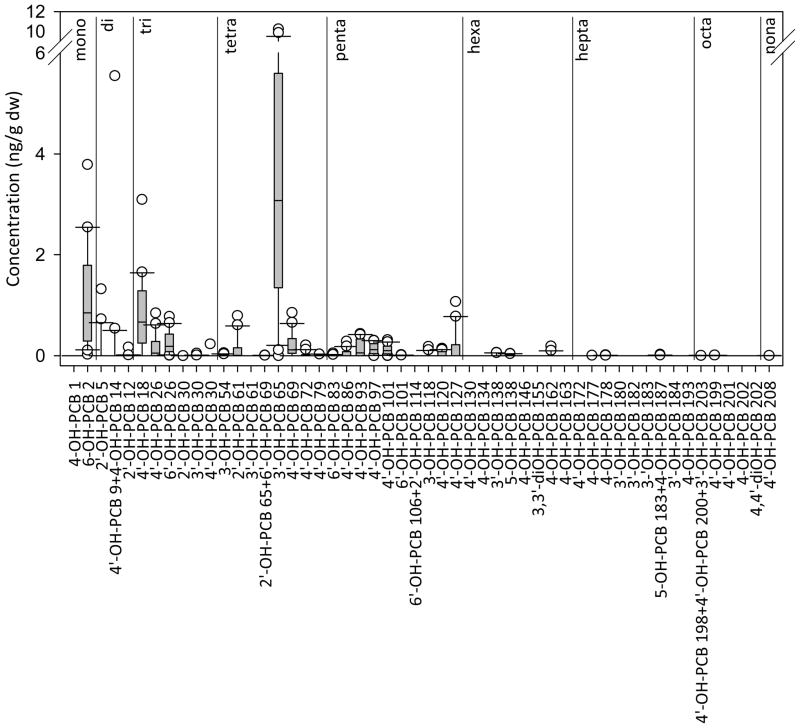
Figure 2.
Distribution of concentration of OH-PCBs in sediment samples (n = 20). Congeners are listed from low to high PCB number and are grouped according to homologue. Data are plotted as box plots with the median indicated by the bold horizontal line, the two middle quartiles shown as polyhedrons above and below the median and the 95th percentiles shown as the horizontal lines connected by a solid vertical line. Outlier points are indicated by open circles. Congener mass below LOQ was given a value of zero. The most prominent congener, 3′-OH-PCB 65, is also the most prominent congener in Aroclors 1221, 1242, 1248, and 1254. Data are in Table S4.

