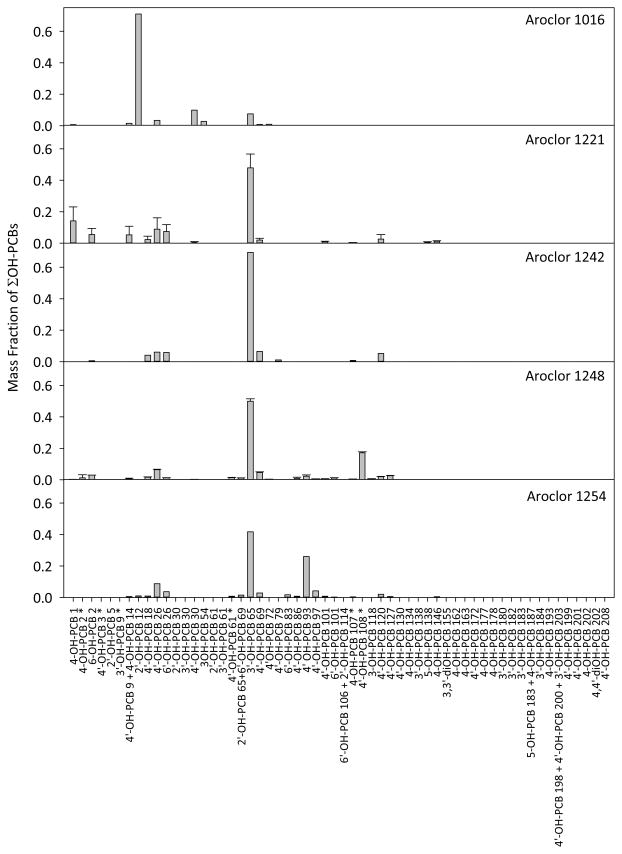
Figure 6.
Congener profiles of OH-PCBs in original commercial Aroclors. Aroclor 1221 and Aroclor 1248 profiles represent the average and error bars represent the standard deviation of three replicates. Asterisks indicate congeners not included in the sediment data set. The profile of Aroclor 1016 is different from the samples and other Aroclors. Aroclor data are in Table S5.

