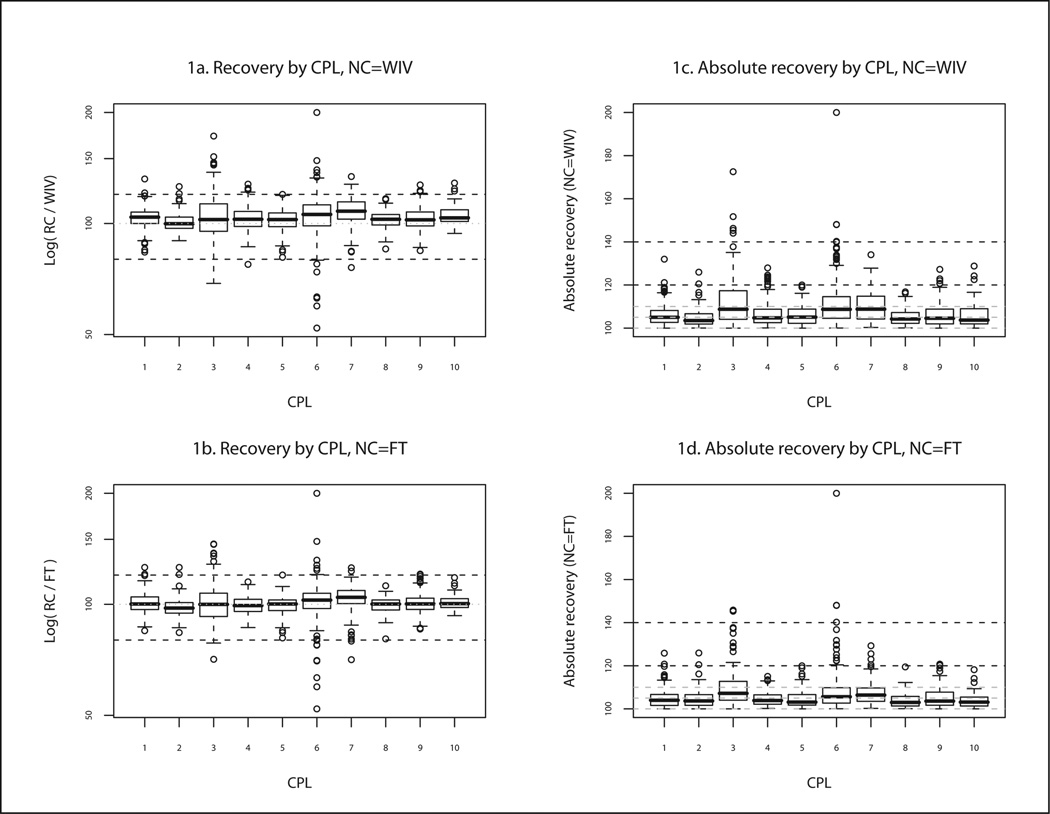
Figure 1. Box plots of log recoveries and absolute recoveries by CPL, for two different types of nominal concentrations.
Upper and lower left (1a and 1b): Box plots of log recovery, defined as natural log of reported/nominal concentration (RC/NC), where NC is defined as the weighed-in value (WIV) and the final target (FT) in the upper and lower plots, respectively. Dotted gray line at 100% indicates perfect agreement between RC and NC. Dashed black lines indicate recoveries of 80% and 120%.
Upper and lower right (1c and 1d): Box plots of absolute recovery, defined as 100* [NC + abs(NC-RC)]/NC . Dashed gray lines indicate absolute recoveries of 100%, 105% and 110%; dashed black lines indicate absolute recoveries of 120% and 140%. The box's bold center line is the median. The upper and lower edges of box represent the 25th and 75th percentiles. The whiskers extend to either: (1) 1.5 times the interquartile range (the distance between 25th and 75th percentiles) or the (2) most extreme point, whichever is closer to the box. Points outside the whiskers are displayed individually. These points are outliers relative to the box plot, but without positing a particular distribution for the concentrations, no probabilistic statement is inferred.

