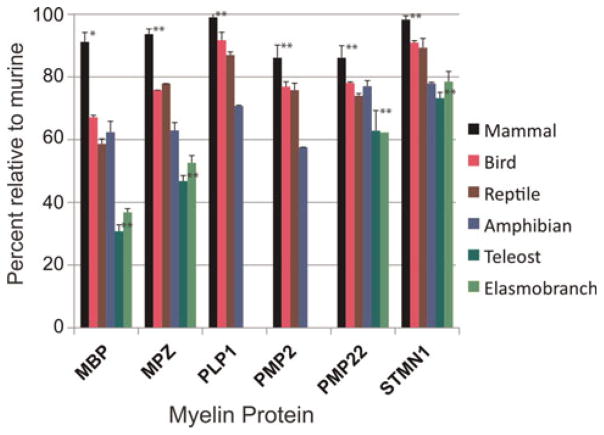
Fig. 3.
Pair-wise amino acid identity comparisons of all full-length sequences (see supplementary Tables 1A and 1B online) from each taxon with its murine counterpart are plotted. Mean and standard deviations are included. Statistical analyses (Prism 4, Graphpad program) were limited to comparisons among mammalian and teleost sequences and significance differences between MBP versus other myelin proteins are displayed (* – P < 0.05, ** – P < 0.0001, all others). Except for mammalian PLP1 and STMN1, comparisons show that conservations of each protein were different from other myelin proteins. Detailed information on comparative studies is presented in supplementary Table 2 online.

