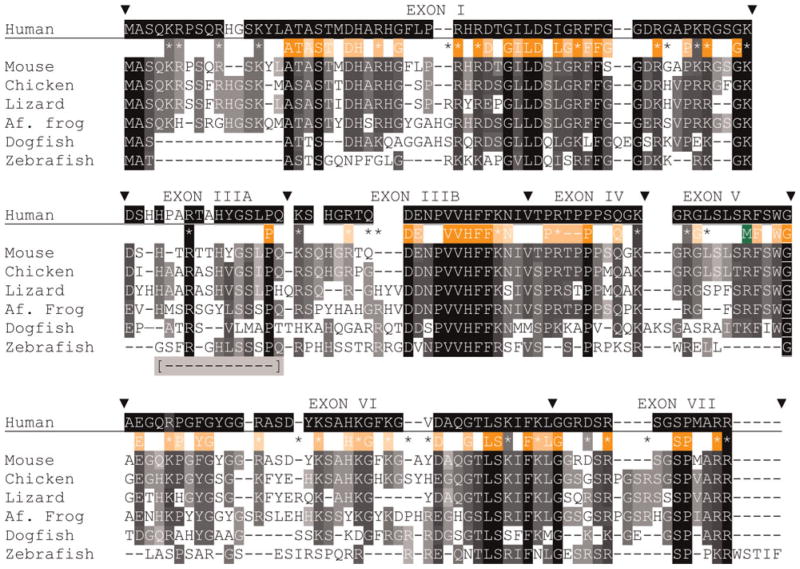
Fig. 4. Alignments of MBP sequences (isoform 3, contains all but exon II) from species that represent each gnathostome taxon.
Accession numbers are listed in supplementary Tables 1A and 1B online. Alignments are made, exon-by-exon with Clustal W (Methods), merged into a single alignment, and finally modified by eye. Comparisons among all listed species, excepting human use white letters on a black background (
 ) for complete identity, white letters on gray background for blocks of identity (>2) and conserved substitutions (
 ); the background shading is set to the number of sequences with the same amino acid – darker background are for greater number of sequences. For simplicity, conserved substitutions are considered the same as identical amino acids. Exon boundaries are marked (θ) with exon numbers above the human sequence. Positions of all basic (K, R) amino acids are shown with coloring indicating complete identity (
 ) and (
 ) conservation and presence in sequences of one or two species (*). Sixty-nine HMM logo (PFAM) amino acids were selected based on individual or conserved substitution contributions >1.0 and shown with white lettering on orange backgrounds. As above, darker background shading indicates greater sequence identity. Letters and basic residue designations are placed between human and murine sequences. A single arginine methylation site is shown below the human sequence (M). A portion of exon III, absent in the common zebrafish 88 amino acid isoform is indicated [
 ] and assigned IIIA (see supplementary Table 3 online).

