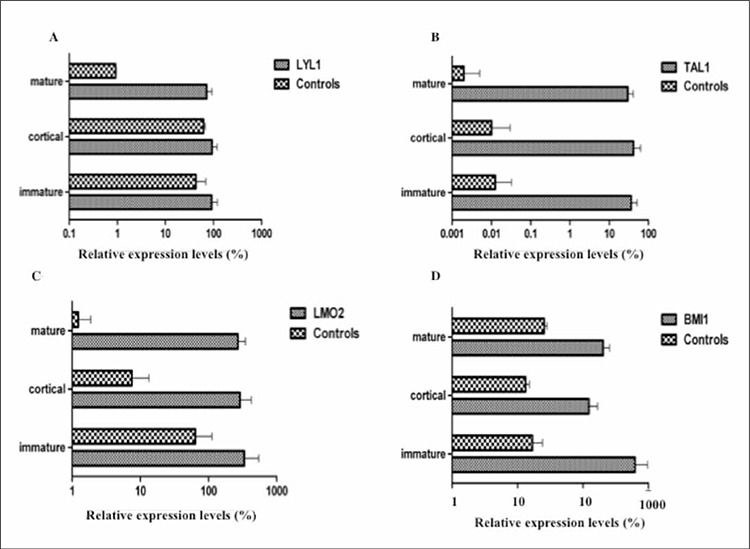
Figure 1. QRT-PCR analysis of oncogenes in the pediatric T-ALL patient subgroups (according to EGIL criteria) and normal thymic control subsets. A. LYL1 expression was significantly higher in the cortical and mature stage subgroups, as compared to their specific controls (cortical versus control: P = 0.02; mature versus control: P = 0.007). B. TAL1 expression was significantly higher in allthe phenotypic subgroups than in the controls (immature versus control: P = 0.01; cortical versus control: P = 0.01; mature versuscontrol; P = 0.02 [Mann-Whitney U test]). C. LMO2 expression was significantly higher in the cortical and mature stage subgroupsthan in the controls (cortical versus control: P = 0.05; mature versus control: P = 0.007). D. BMI1 expression was higher in all thephenotypic subgroups than in their specific controls (immature versus control: P = 0.01; cortical versus control: P = 0.01; mature versus control: P = 0.01).

