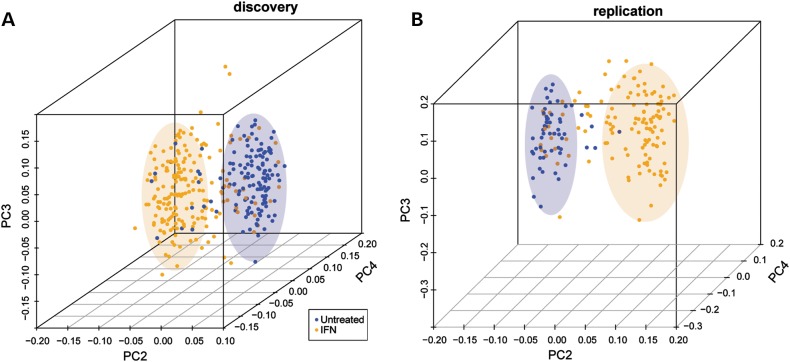
Figure 1.
PCA of untreated and IFN-treated patients by the expression of IFN signature genes in the discovery (A) and replication (B) data sets. On the x-axis, principal component (PC) 2 is plotted, on the y-axis PC 3 and on the z-axis PC 4. IFN-treated patients are displayed in orange, untreated patients in blue. As indicated by the colored ellipses, these principal components split samples into two groups, corresponding to whether subjects were treated or not.

