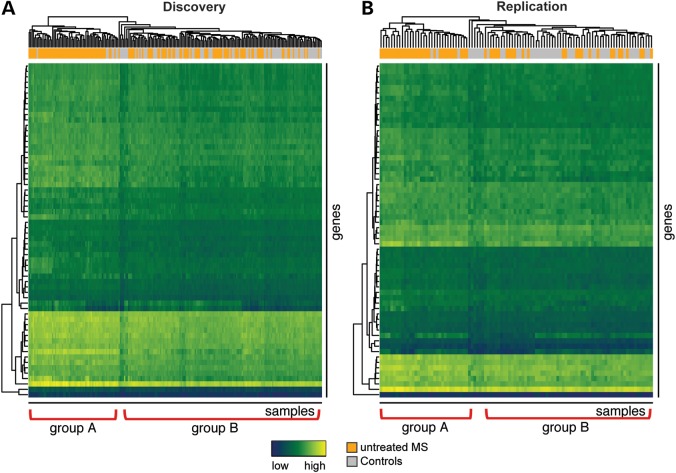
Figure 2.
Unsupervised hierarchical clustering of MS patients and healthy controls according to the expression of MS signature genes in the discovery (A) and the replication (B) data sets. The rows are different genes, the columns reflect different experiments. The colored bar above the heatmap identifies patients (orange) and controls (grey). Two subgroups of MS patients, group A with a stronger signature and group B, emerge. Blue depicts low expression and yellow high expression. Hierarchical clustering was performed using Euclidean distance and average clustering.

