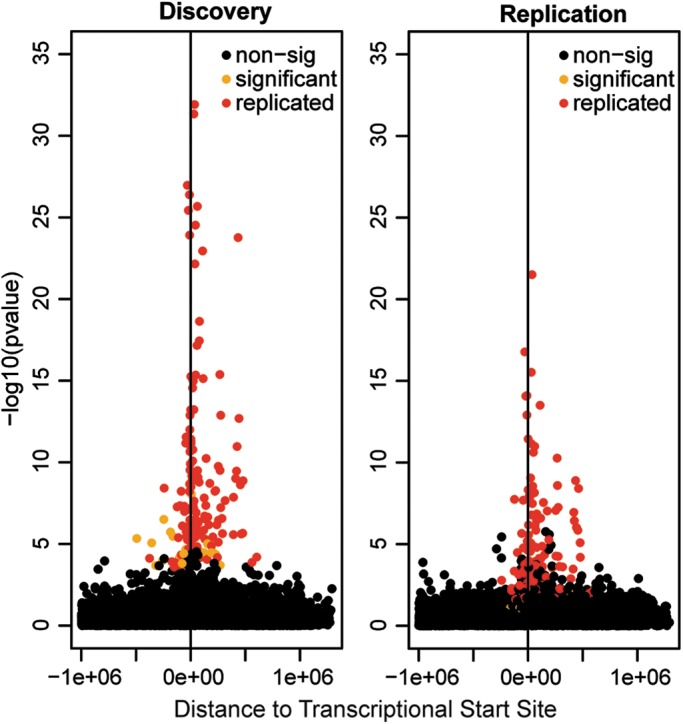
Figure 3.

Location of general cis-eQTL. Association P-values in discovery (A) and replication (B) data sets are plotted against the distance of each cis-SNP from the transcription start of studied transcripts. SNPs that were found to be significant in both discovery and replication data sets (replicated) are displayed in red, those with significant P-values only in the discovery data set (significant) are displayed in orange, all non-significant SNPs (non-sig) are shown in black.
