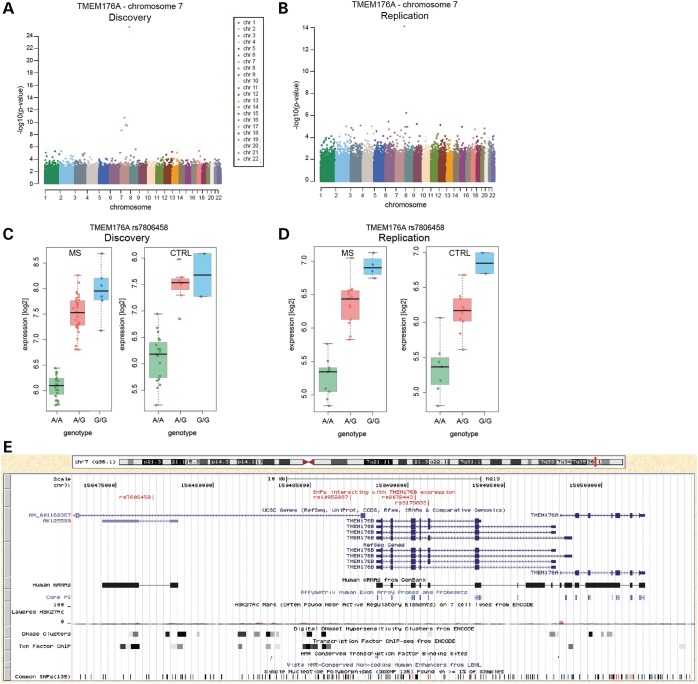
Figure 4.
Genetic make-up of MS gene cis-eQTL. (A and B) Manhattan plots of association P-values of all studied SNPs and the expression of one of the MS-associated genes with replicated cis-eQTL, TMEM176A, encoded on chromosome 7, in the discovery (A) and the replication (B) data sets. Each chromosome is displayed in a different color. Note the pronounced peak of association P-values on chromosome 7, on which TMEM176A is encoded, especially in the discovery data set. (C and D) Log2-transformed expression values for TMEM176A in dependence of the most significantly associated SNP, rs7806458 (genotype), in the discovery (C) and the replication (D) data sets in both MS patients (MS) and controls (CTRL). (E) University of California at Santa Cruz (UCSC) genome browser-based visualization of the genetic locus comprising TMEM176A, TMEM176B and the SNPs associated with their expression (shared: rs7806458, rs10952287, rs2072443; TMEM176B only: rs3173833), marked in red in the upper track. In addition to UCSC genes, RefSeqGenes and Human mRNA tracks, location of the probes on the analyzed microarray (‘Core PS’, Affy Exon Array) as well as the Encode Integrated Regulation tracks ‘Layered H3K27Ac’, ‘DNase Clusters’ and ‘Txn Factor ChIP’ are shown. Also, Vista Enhancers (‘HMR-Conserved Non-coding Human Enhancers’) and transcription factor binding sites (‘HMR Conserved Transcription Factor Binding Sites’, TFBS conserved) are displayed. Common SNPs (as of dbSNP v135) are shown in the bottom track.

