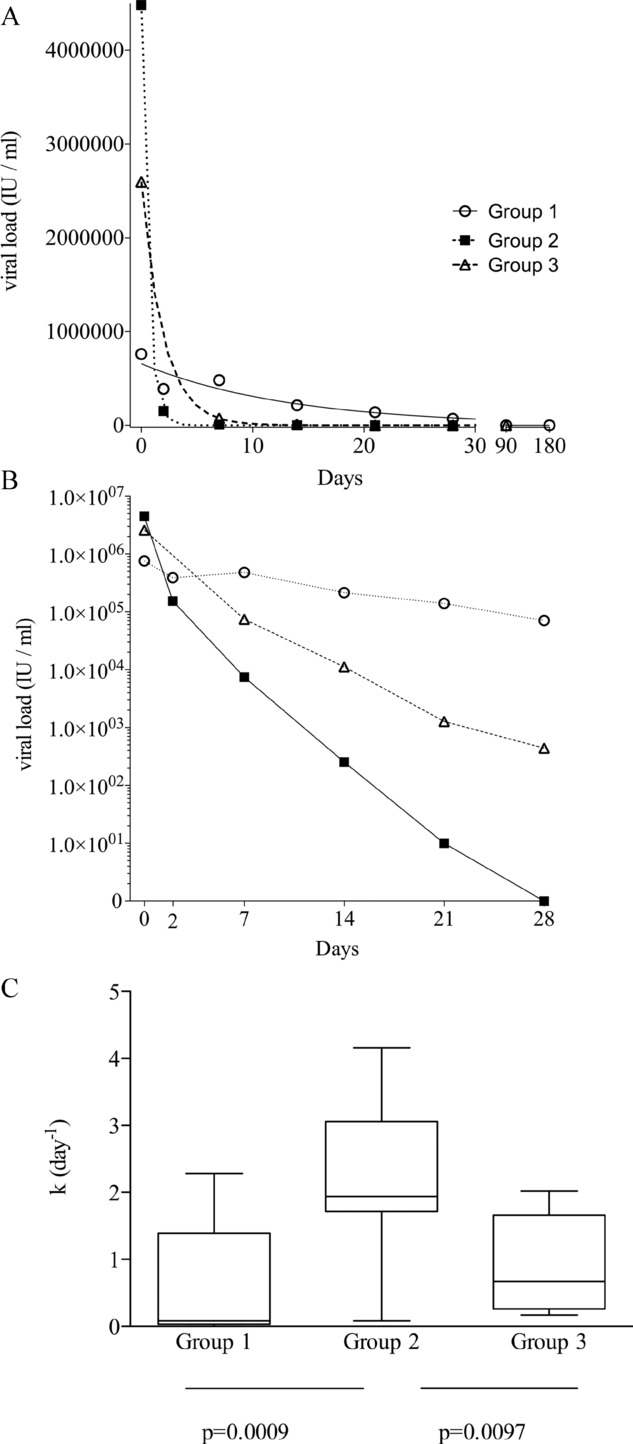
Figure 3.

The kinetics of viral clearance. Serum was collected at multiple time points (days 0, 2, 7, 14, 21, 28, and then 3 monthly) and viral load measured. (A) Representative examples of viral clearance are shown for a patient from each of the three groups. k (day−1) is the rate constant for the viral clearance, the higher value indicating more rapid clearance of virus. The rate constant k in day−1 of viral clearance is calculated on these curves. Group 1 patient, k = 0.08 day−1; Group 2, patient k = 4.162 day−1; Group 3 patient, k = 0.51 day−1. (B) Viral clearance shown on a logarithmic scale for a representative patient from each group over the first 28 days of treatment. (C) Summary of all the rate constants calculated as in (A) for each group (Group 1, n = 9; Group 2, n = 17; Group 3, n = 7). Data are shown as median (bar), 25th and 75th interquartile (box) and range (whiskers) of the indicated number of samples. The rapid clearance was greatest in Group 2 (p = 0.0006, one-way ANOVA).
