
Figure 4.
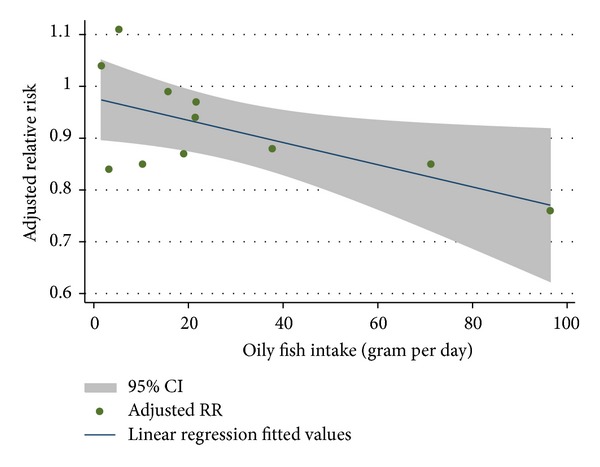
Linear regression of adjusted RR of T2D versus oily fish intake. The upper and lower bands denote the 95% confidence interval on mean of the predicted value, R 2 = 0.40.
Official websites use .gov
A
.gov website belongs to an official
government organization in the United States.
Secure .gov websites use HTTPS
A lock (
) or https:// means you've safely
connected to the .gov website. Share sensitive
information only on official, secure websites.
Linear regression of adjusted RR of T2D versus oily fish intake. The upper and lower bands denote the 95% confidence interval on mean of the predicted value, R 2 = 0.40.