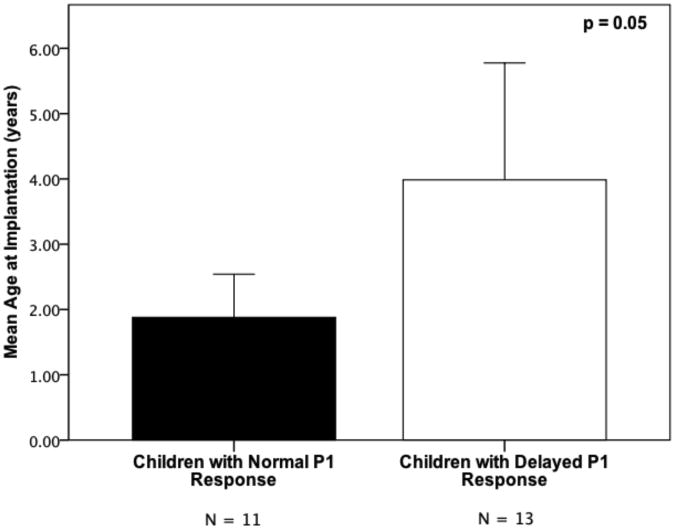
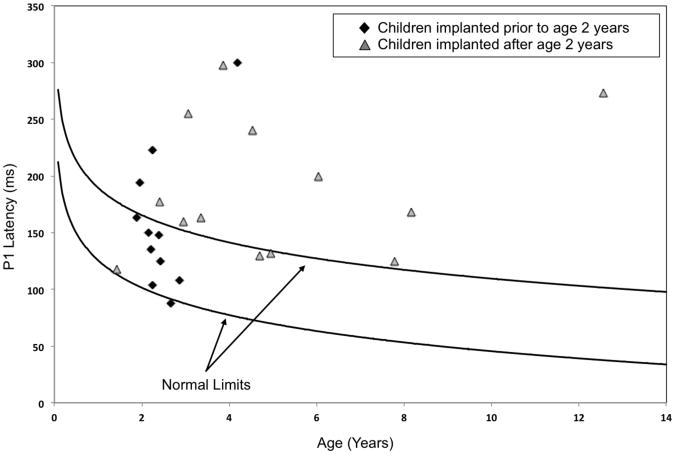
Figure 2.
Panel A – Comparison of mean age at implantation for the groups of children with normal and delayed P1 CAEP responses, respectively. Error bars indicate the standard error of the mean.
Panel B – P1 latencies for each participant in the current study plotted against the 95% confidence intervals for normal P1 latency development (solid lines; adapted from Sharma et al, 2002a). Solid black diamonds represent children who were fitted with a CI before 2 years of age, while solid grey triangles mark children who received their CI at or after the age of 2 years.


